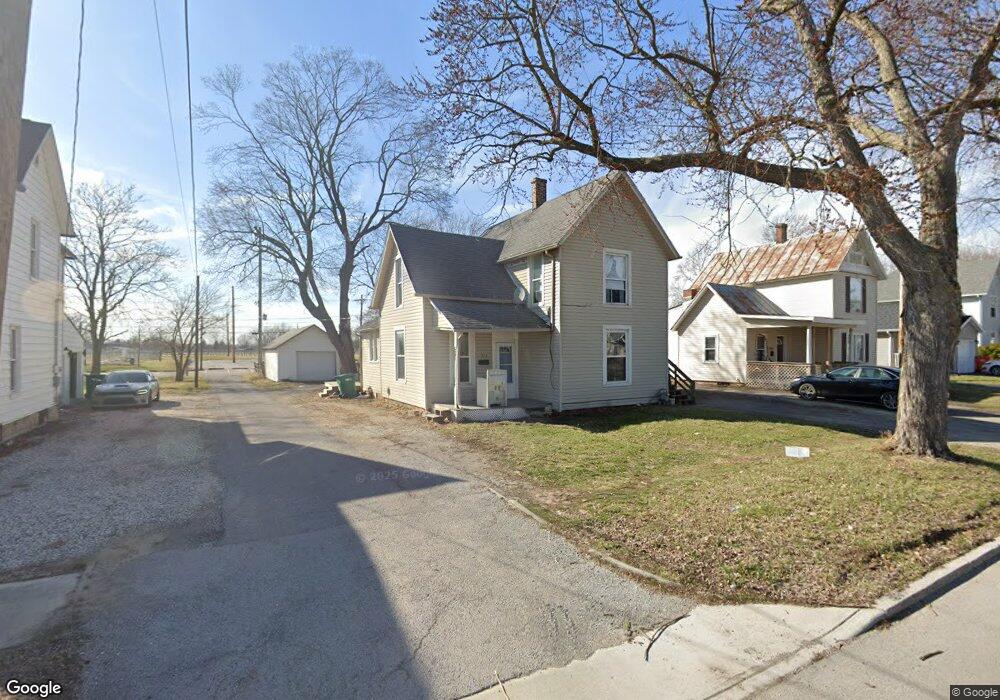
518 N Cory St Findlay, OH 45840
Estimated Value: $130,276 - $172,000
3
Beds
2
Baths
1,433
Sq Ft
$100/Sq Ft
Est. Value
About This Home
This home is located at 518 N Cory St, Findlay, OH 45840 and is currently estimated at $143,819, approximately $100 per square foot. 518 N Cory St is a home located in Hancock County with nearby schools including Whittier Primary School, Bigelow Hill Elementary School, and Glenwood Middle School.
Ownership History
Date
Name
Owned For
Owner Type
Purchase Details
Closed on
Jan 2, 2002
Sold by
Hoerig Todd J
Bought by
Brickner Chad A
Current Estimated Value
Home Financials for this Owner
Home Financials are based on the most recent Mortgage that was taken out on this home.
Original Mortgage
$70,000
Outstanding Balance
$28,259
Interest Rate
6.87%
Mortgage Type
New Conventional
Estimated Equity
$115,560
Purchase Details
Closed on
Mar 26, 1998
Sold by
Frantz Brian
Bought by
Hoerig Todd
Home Financials for this Owner
Home Financials are based on the most recent Mortgage that was taken out on this home.
Original Mortgage
$63,139
Interest Rate
7.15%
Mortgage Type
FHA
Purchase Details
Closed on
Jul 21, 1995
Sold by
Anast Frank
Bought by
Frantz Brian and Hough Jackie
Home Financials for this Owner
Home Financials are based on the most recent Mortgage that was taken out on this home.
Original Mortgage
$46,800
Interest Rate
7.5%
Mortgage Type
New Conventional
Create a Home Valuation Report for This Property
The Home Valuation Report is an in-depth analysis detailing your home's value as well as a comparison with similar homes in the area
Home Values in the Area
Average Home Value in this Area
Purchase History
| Date | Buyer | Sale Price | Title Company |
|---|---|---|---|
| Brickner Chad A | $70,000 | -- | |
| Hoerig Todd | $63,181 | -- | |
| Frantz Brian | $52,000 | -- |
Source: Public Records
Mortgage History
| Date | Status | Borrower | Loan Amount |
|---|---|---|---|
| Open | Brickner Chad A | $70,000 | |
| Previous Owner | Hoerig Todd | $63,139 | |
| Previous Owner | Frantz Brian | $46,800 |
Source: Public Records
Tax History Compared to Growth
Tax History
| Year | Tax Paid | Tax Assessment Tax Assessment Total Assessment is a certain percentage of the fair market value that is determined by local assessors to be the total taxable value of land and additions on the property. | Land | Improvement |
|---|---|---|---|---|
| 2024 | $1,024 | $28,080 | $5,220 | $22,860 |
| 2023 | $1,025 | $28,080 | $5,220 | $22,860 |
| 2022 | $1,022 | $28,080 | $5,220 | $22,860 |
| 2021 | $931 | $22,290 | $5,210 | $17,080 |
| 2020 | $931 | $22,290 | $5,210 | $17,080 |
| 2019 | $913 | $22,290 | $5,210 | $17,080 |
| 2018 | $869 | $19,480 | $4,530 | $14,950 |
| 2017 | $870 | $19,480 | $4,530 | $14,950 |
| 2016 | $869 | $19,480 | $4,530 | $14,950 |
| 2015 | $741 | $16,480 | $4,530 | $11,950 |
| 2014 | $741 | $16,480 | $4,530 | $11,950 |
| 2012 | $857 | $18,900 | $4,530 | $14,370 |
Source: Public Records
Map
Nearby Homes
- 224 Defiance Ave
- 512 N Cory St
- 706 N Cory St
- 207 Ash Ave
- 0 Canadian Way Unit 20253551
- 0 Canadian Way Unit 6135400
- 213 Cherry St
- 524 Defiance Ave
- 115 George St
- 247 Crystal Ave
- 407 Washington St
- 206 Midland Ave
- 533 Davis St
- 230 Midland Ave
- 210 Western Ave
- 604 Davis St
- 523 Center St
- 1005 Broad Ave
- 545 Clinton Ct
- 420 Allen Ave
- 520 N Cory St
- 524 N Cory St
- 510 N Cory St
- 508 N Cory St
- 528 N Cory St
- 506 N Cory St
- 519 N Cory St
- 133 Defiance Ave
- 133 Defiance Ave Unit Front
- 133 Defiance Ave Front
- 500 N Cory St
- 127 Defiance Ave
- 515 N Cory St
- 509 N Cory St
- 221 Defiance Ave
- 200 Defiance Ave
- 125 Defiance Ave
- 204 Defiance Ave
- 420 N Cory St
- 200 E Sandusky St