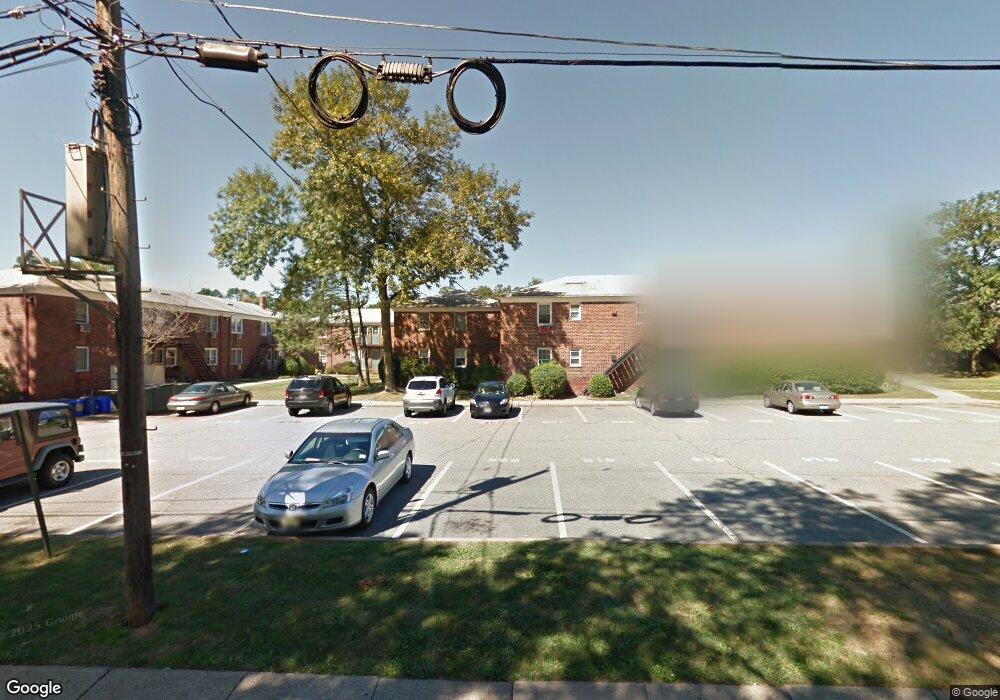
518 Pitney Place Unit 518 Morristown, NJ 07960
Estimated Value: $364,000 - $380,000
2
Beds
1
Bath
930
Sq Ft
$403/Sq Ft
Est. Value
About This Home
This home is located at 518 Pitney Place Unit 518, Morristown, NJ 07960 and is currently estimated at $375,173, approximately $403 per square foot. 518 Pitney Place Unit 518 is a home located in Morris County with nearby schools including Hillcrest School, Thomas Jefferson School, and Alexander Hamilton School.
Ownership History
Date
Name
Owned For
Owner Type
Purchase Details
Closed on
Dec 21, 2015
Sold by
Crowley Ryan J and Crowley Molly E
Bought by
Urrea Victoria
Current Estimated Value
Home Financials for this Owner
Home Financials are based on the most recent Mortgage that was taken out on this home.
Original Mortgage
$236,634
Outstanding Balance
$187,883
Interest Rate
3.99%
Mortgage Type
FHA
Estimated Equity
$187,290
Purchase Details
Closed on
Apr 2, 2009
Sold by
Brunskill Stephen T and Merkel Brunskill Michelle
Bought by
Crowley Ryan J
Home Financials for this Owner
Home Financials are based on the most recent Mortgage that was taken out on this home.
Original Mortgage
$192,000
Interest Rate
4.94%
Mortgage Type
Purchase Money Mortgage
Purchase Details
Closed on
Sep 30, 2003
Sold by
Isel Shirley
Bought by
Brunskill Stephen
Purchase Details
Closed on
Dec 21, 1999
Sold by
Amoresano Diane
Bought by
Isel Shirley A
Purchase Details
Closed on
Mar 3, 1996
Sold by
Baehl Robert D and Baehl Kathleen Q
Bought by
Amoresano Diane
Create a Home Valuation Report for This Property
The Home Valuation Report is an in-depth analysis detailing your home's value as well as a comparison with similar homes in the area
Home Values in the Area
Average Home Value in this Area
Purchase History
| Date | Buyer | Sale Price | Title Company |
|---|---|---|---|
| Urrea Victoria | $245,000 | Foundation Title Llc | |
| Crowley Ryan J | $240,000 | New Jersey Land Title | |
| Brunskill Stephen | $200,000 | -- | |
| Isel Shirley A | $130,000 | Chicago Title Insurance Co | |
| Amoresano Diane | $115,000 | Chicago Title Insurance Co |
Source: Public Records
Mortgage History
| Date | Status | Borrower | Loan Amount |
|---|---|---|---|
| Open | Urrea Victoria | $236,634 | |
| Previous Owner | Crowley Ryan J | $192,000 |
Source: Public Records
Tax History Compared to Growth
Tax History
| Year | Tax Paid | Tax Assessment Tax Assessment Total Assessment is a certain percentage of the fair market value that is determined by local assessors to be the total taxable value of land and additions on the property. | Land | Improvement |
|---|---|---|---|---|
| 2025 | $4,006 | $200,100 | $115,000 | $85,100 |
| 2024 | $4,012 | $200,100 | $115,000 | $85,100 |
| 2023 | $4,012 | $200,100 | $115,000 | $85,100 |
| 2022 | $3,826 | $200,100 | $115,000 | $85,100 |
| 2021 | $3,826 | $200,100 | $115,000 | $85,100 |
| 2020 | $3,726 | $200,100 | $115,000 | $85,100 |
| 2019 | $3,668 | $200,100 | $115,000 | $85,100 |
| 2018 | $3,628 | $200,100 | $115,000 | $85,100 |
| 2017 | $3,604 | $200,100 | $115,000 | $85,100 |
| 2016 | $3,548 | $200,100 | $115,000 | $85,100 |
| 2015 | $3,550 | $140,000 | $70,000 | $70,000 |
| 2014 | $3,504 | $140,000 | $70,000 | $70,000 |
Source: Public Records
Map
Nearby Homes
- 508 Pitney Place Unit 508
- 309 Pitney Place Unit 309
- 16 Lidgerwood Place
- 1A Dorado Dr
- 180 Franklin St
- 14 Howland Terrace
- 39 Crescent Dr
- 320 South St Unit G
- 320 South St Unit O
- 4 Barberry Rd
- 55 Georgian Rd
- 15 Woodland Ave
- 139 Woodland Ave
- 2 Hadley Way
- 15 Georgian Rd
- 93 Columbia Rd
- 15 Harding Rd
- 21 Symor Dr
- 12 Canfield Rd
- 21 Franklin Place
- 517 Pitney Place
- 519 Pitney Place Unit 519
- 516 Pitney Place Unit 516
- 520 Pitney Place Unit 520
- 515 Pitney Place Unit 515
- 521 Pitney Place Unit 521
- 522 Pitney Place
- 513 Pitney Place
- 510 Pitney Place
- 511 Pitney Place
- 523 Pitney Place Unit 523
- 512 Pitney Place
- 509 Pitney Place Unit 509
- 524 Pitney Place
- 507 Pitney Place
- 601 Pitney Place
- 506 Pitney Place
- 506 Pitney Place Unit 1
- 602 Pitney Place
- 603 Pitney Place Unit 603