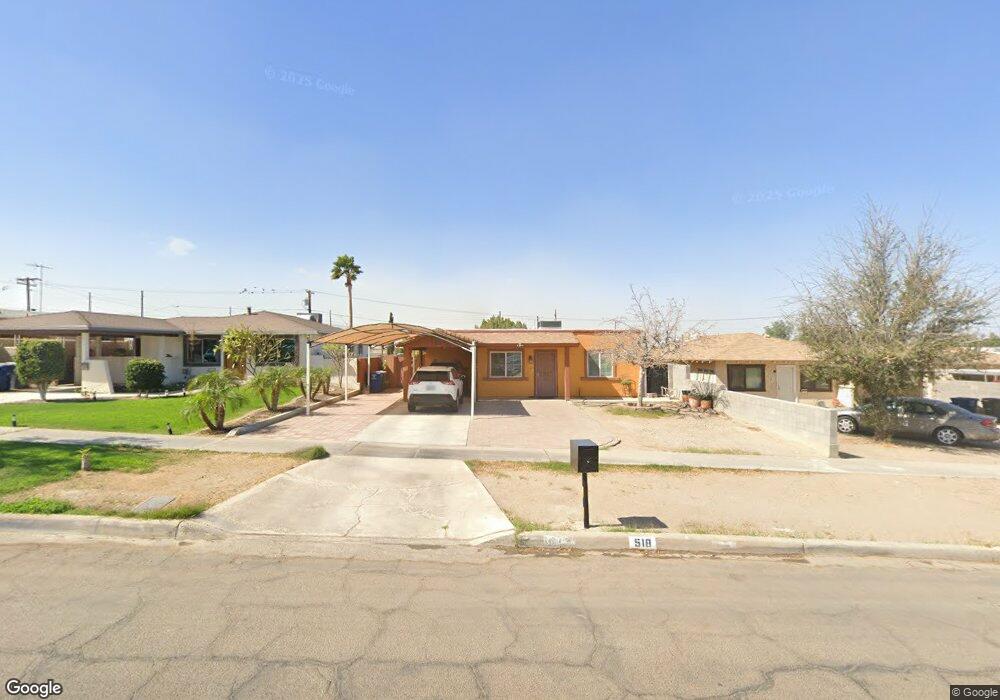
518 S 10th Ave Yuma, AZ 85364
Avenues NeighborhoodEstimated Value: $204,239 - $242,000
3
Beds
2
Baths
910
Sq Ft
$246/Sq Ft
Est. Value
About This Home
This home is located at 518 S 10th Ave, Yuma, AZ 85364 and is currently estimated at $224,310, approximately $246 per square foot. 518 S 10th Ave is a home located in Yuma County with nearby schools including George Washington Carver Elementary School, Fourth Avenue Junior High School, and Yuma High School.
Ownership History
Date
Name
Owned For
Owner Type
Purchase Details
Closed on
May 20, 2004
Sold by
Taylor Elaine N Whitney and Taylor John J
Bought by
Villa Aureliano and Villa Mirna C
Current Estimated Value
Home Financials for this Owner
Home Financials are based on the most recent Mortgage that was taken out on this home.
Original Mortgage
$73,160
Outstanding Balance
$35,719
Interest Rate
6.09%
Mortgage Type
New Conventional
Estimated Equity
$188,591
Create a Home Valuation Report for This Property
The Home Valuation Report is an in-depth analysis detailing your home's value as well as a comparison with similar homes in the area
Home Values in the Area
Average Home Value in this Area
Purchase History
| Date | Buyer | Sale Price | Title Company |
|---|---|---|---|
| Villa Aureliano | $82,400 | First American Title |
Source: Public Records
Mortgage History
| Date | Status | Borrower | Loan Amount |
|---|---|---|---|
| Open | Villa Aureliano | $73,160 | |
| Closed | Villa Aureliano | $11,240 |
Source: Public Records
Tax History Compared to Growth
Tax History
| Year | Tax Paid | Tax Assessment Tax Assessment Total Assessment is a certain percentage of the fair market value that is determined by local assessors to be the total taxable value of land and additions on the property. | Land | Improvement |
|---|---|---|---|---|
| 2025 | $1,071 | $10,683 | $2,846 | $7,837 |
| 2024 | $1,052 | $10,174 | $2,773 | $7,401 |
| 2023 | $1,052 | $9,689 | $2,861 | $6,828 |
| 2022 | $1,015 | $9,228 | $2,296 | $6,932 |
| 2021 | $1,077 | $8,789 | $2,310 | $6,479 |
| 2020 | $984 | $8,370 | $2,391 | $5,979 |
| 2019 | $966 | $7,971 | $2,510 | $5,461 |
| 2018 | $918 | $7,591 | $2,557 | $5,034 |
| 2017 | $879 | $7,591 | $2,557 | $5,034 |
| 2016 | $859 | $6,886 | $2,600 | $4,286 |
| 2015 | $860 | $7,772 | $2,030 | $5,742 |
| 2014 | $860 | $7,402 | $1,335 | $6,067 |
Source: Public Records
Map
Nearby Homes