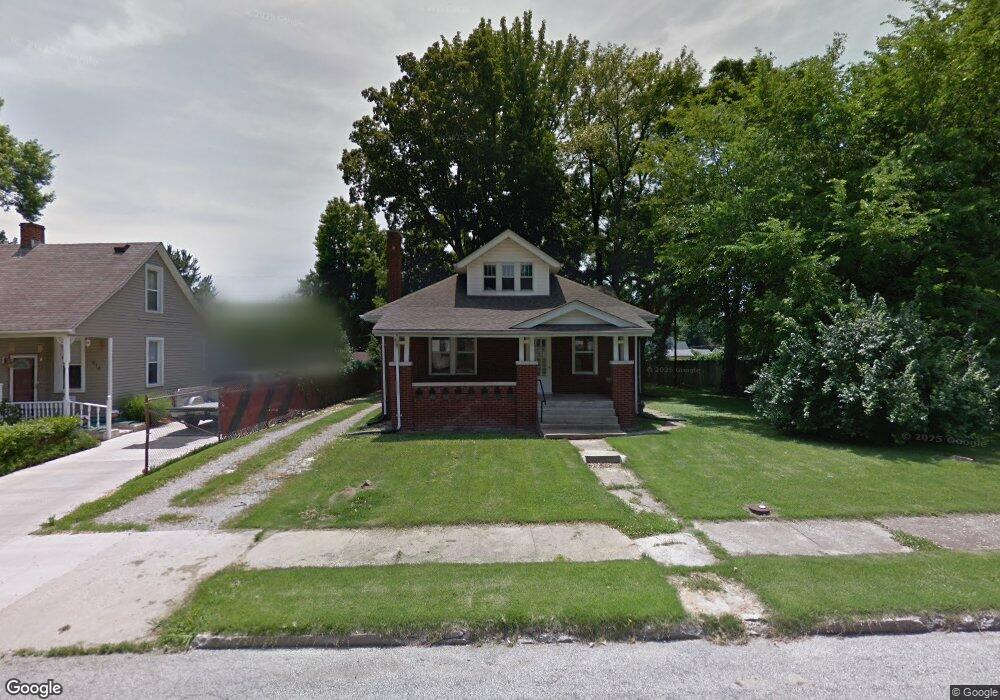
518 S 21st St Belleville, IL 62226
Estimated Value: $142,000 - $152,561
4
Beds
2
Baths
1,888
Sq Ft
$78/Sq Ft
Est. Value
About This Home
This home is located at 518 S 21st St, Belleville, IL 62226 and is currently estimated at $147,640, approximately $78 per square foot. 518 S 21st St is a home located in St. Clair County with nearby schools including Union Elementary School, West Jr High School, and Governor French Academy.
Ownership History
Date
Name
Owned For
Owner Type
Purchase Details
Closed on
Jul 10, 2023
Sold by
Hutcheson Michael and Mark Russell Hutcheson Estate Mark Russell Hu
Bought by
Buss Jason E
Current Estimated Value
Home Financials for this Owner
Home Financials are based on the most recent Mortgage that was taken out on this home.
Original Mortgage
$30,600
Outstanding Balance
$29,840
Interest Rate
6.57%
Mortgage Type
New Conventional
Estimated Equity
$117,800
Purchase Details
Closed on
Sep 24, 2019
Sold by
Hutcheson Mark R
Bought by
Hutcheson Mark R
Purchase Details
Closed on
Oct 30, 1998
Bought by
Hutcheson Mark R and Hutcheson Billings B
Create a Home Valuation Report for This Property
The Home Valuation Report is an in-depth analysis detailing your home's value as well as a comparison with similar homes in the area
Home Values in the Area
Average Home Value in this Area
Purchase History
| Date | Buyer | Sale Price | Title Company |
|---|---|---|---|
| Buss Jason E | $36,000 | Town & Country Title | |
| Hutcheson Mark R | -- | Attorney | |
| Hutcheson Mark R | $54,000 | -- |
Source: Public Records
Mortgage History
| Date | Status | Borrower | Loan Amount |
|---|---|---|---|
| Open | Buss Jason E | $30,600 |
Source: Public Records
Tax History Compared to Growth
Tax History
| Year | Tax Paid | Tax Assessment Tax Assessment Total Assessment is a certain percentage of the fair market value that is determined by local assessors to be the total taxable value of land and additions on the property. | Land | Improvement |
|---|---|---|---|---|
| 2024 | $4,453 | $50,633 | $5,726 | $44,907 |
| 2023 | $3,914 | $41,693 | $5,614 | $36,079 |
| 2022 | $3,592 | $37,534 | $5,054 | $32,480 |
| 2021 | $3,460 | $34,699 | $4,672 | $30,027 |
| 2020 | $3,363 | $32,813 | $4,418 | $28,395 |
| 2019 | $3,478 | $33,575 | $4,424 | $29,151 |
| 2018 | $3,401 | $32,849 | $4,328 | $28,521 |
| 2017 | $3,375 | $32,619 | $4,298 | $28,321 |
| 2016 | $3,332 | $31,926 | $4,207 | $27,719 |
| 2014 | $1,583 | $34,230 | $4,409 | $29,821 |
| 2013 | $3,132 | $34,719 | $4,472 | $30,247 |
Source: Public Records
Map
Nearby Homes