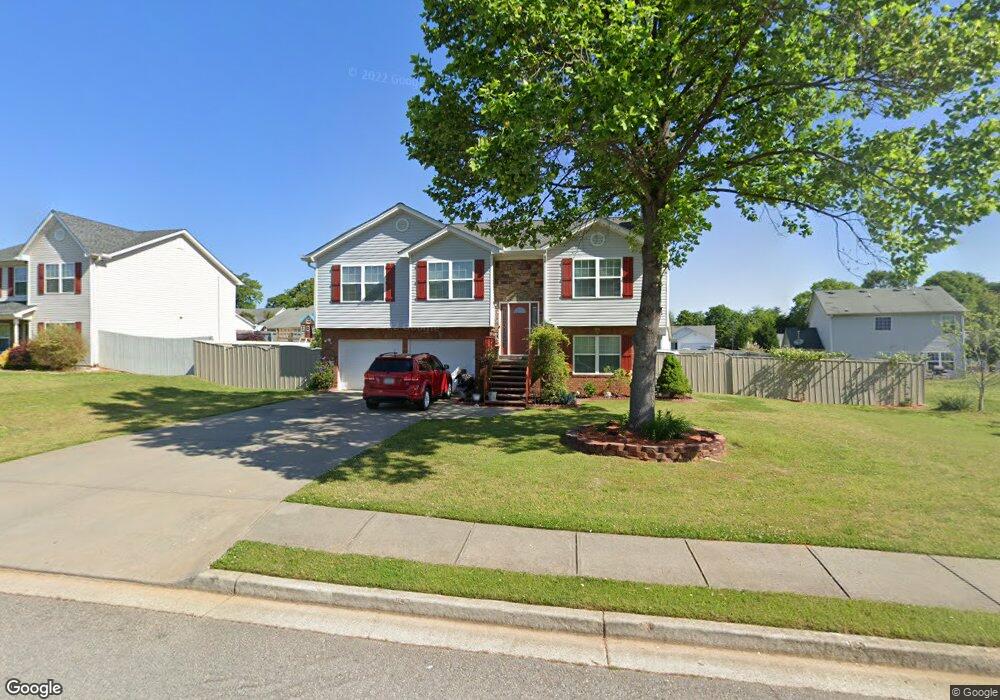
518 Shenandoah Ln Unit 2 Winder, GA 30680
Estimated Value: $288,000 - $302,000
--
Bed
2
Baths
1,298
Sq Ft
$229/Sq Ft
Est. Value
About This Home
This home is located at 518 Shenandoah Ln Unit 2, Winder, GA 30680 and is currently estimated at $296,843, approximately $228 per square foot. 518 Shenandoah Ln Unit 2 is a home located in Barrow County with nearby schools including County Line Elementary School, Russell Middle School, and Winder-Barrow High School.
Ownership History
Date
Name
Owned For
Owner Type
Purchase Details
Closed on
Aug 3, 2004
Sold by
Fletcher Construction Llc
Bought by
Ionashku George and Ionashku Loredana
Current Estimated Value
Home Financials for this Owner
Home Financials are based on the most recent Mortgage that was taken out on this home.
Original Mortgage
$100,720
Interest Rate
6.22%
Mortgage Type
New Conventional
Purchase Details
Closed on
Mar 2, 2004
Sold by
Denney Construction
Bought by
Fletcher Ralph
Purchase Details
Closed on
Oct 9, 2002
Sold by
Shenandoah Partners
Bought by
Denney Construction
Purchase Details
Closed on
Apr 5, 2001
Bought by
Shenandoah Partners
Create a Home Valuation Report for This Property
The Home Valuation Report is an in-depth analysis detailing your home's value as well as a comparison with similar homes in the area
Home Values in the Area
Average Home Value in this Area
Purchase History
| Date | Buyer | Sale Price | Title Company |
|---|---|---|---|
| Ionashku George | $125,900 | -- | |
| Fletcher Ralph | $30,200 | -- | |
| Denney Construction | $61,500 | -- | |
| Shenandoah Partners | -- | -- |
Source: Public Records
Mortgage History
| Date | Status | Borrower | Loan Amount |
|---|---|---|---|
| Closed | Ionashku George | $100,720 |
Source: Public Records
Tax History Compared to Growth
Tax History
| Year | Tax Paid | Tax Assessment Tax Assessment Total Assessment is a certain percentage of the fair market value that is determined by local assessors to be the total taxable value of land and additions on the property. | Land | Improvement |
|---|---|---|---|---|
| 2024 | $2,467 | $101,211 | $23,200 | $78,011 |
| 2023 | $1,765 | $91,388 | $22,000 | $69,388 |
| 2022 | $2,430 | $80,800 | $16,000 | $64,800 |
| 2021 | $2,057 | $64,489 | $14,000 | $50,489 |
| 2020 | $1,859 | $58,912 | $12,000 | $46,912 |
| 2019 | $1,883 | $58,912 | $12,000 | $46,912 |
| 2018 | $1,694 | $51,411 | $10,000 | $41,411 |
| 2017 | $1,216 | $40,749 | $10,000 | $30,749 |
| 2016 | $1,163 | $38,300 | $10,000 | $28,300 |
| 2015 | $1,175 | $38,610 | $10,000 | $28,610 |
| 2014 | $1,030 | $34,996 | $6,076 | $28,920 |
| 2013 | -- | $33,576 | $6,076 | $27,500 |
Source: Public Records
Map
Nearby Homes
- 516 Shenandoah Ln
- 331 Shenandoah Cir
- 333 Shenandoah Cir
- 333 Shenandoah Cir Unit 2
- 329 Shenandoah Cir Unit 3729
- 329 Shenandoah Cir
- 329 Shenandoah Cir Unit 2
- 519 Shenandoah Ln
- 521 Shenandoah Ln Unit 2
- 514 Shenandoah Ln
- 517 Shenandoah Ln Unit 2
- 0 Shenandoah Cir Unit 8698667
- 0 Shenandoah Cir Unit 8653158
- 0 Shenandoah Cir Unit 8497861
- 0 Shenandoah Cir Unit 8843669
- 0 Shenandoah Cir Unit 8181037
- 0 Shenandoah Cir Unit 8082513
- 0 Shenandoah Cir Unit 7376356
- 0 Shenandoah Cir Unit 7162991
- 0 Shenandoah Cir Unit 3276409