Estimated Value: $138,788 - $160,000
2
Beds
1
Bath
960
Sq Ft
$159/Sq Ft
Est. Value
About This Home
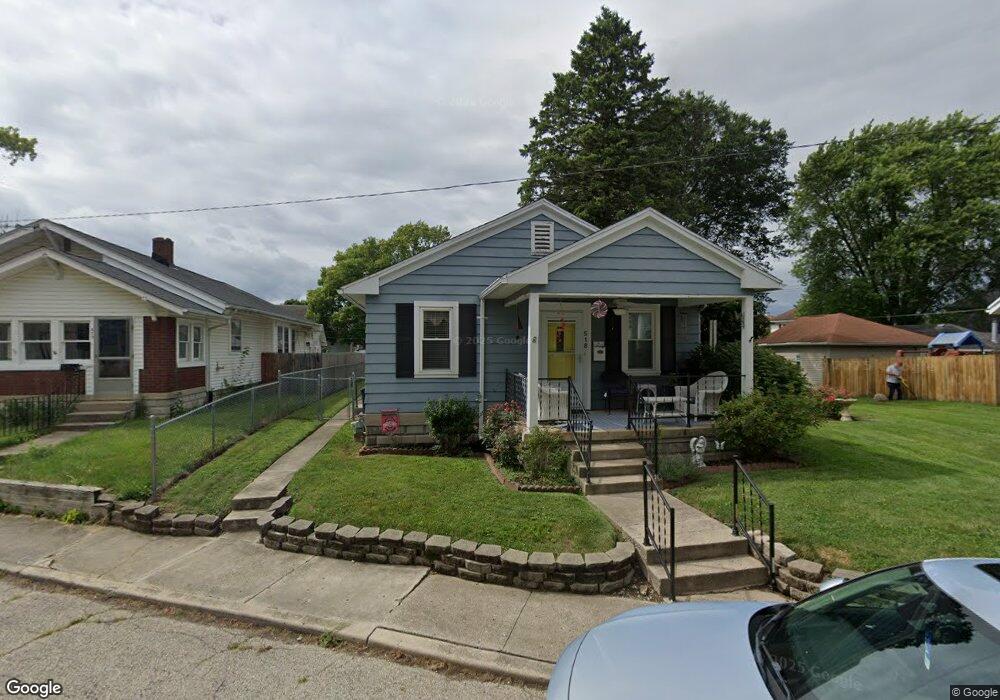
This home is located at 518 Vine St, Piqua, OH 45356 and is currently estimated at $152,697, approximately $159 per square foot. 518 Vine St is a home located in Miami County with nearby schools including Piqua Central Intermediate School, Springcreek Primary School, and Piqua Junior High School.
Ownership History
Date
Name
Owned For
Owner Type
Purchase Details
Closed on
Jun 15, 1999
Sold by
Didot Barbara A
Bought by
Thomas Larry K and Thomas Emma R
Current Estimated Value
Home Financials for this Owner
Home Financials are based on the most recent Mortgage that was taken out on this home.
Original Mortgage
$68,864
Outstanding Balance
$18,072
Interest Rate
6.99%
Mortgage Type
FHA
Estimated Equity
$134,625
Purchase Details
Closed on
Jul 14, 1992
Bought by
Didot Barbara A
Create a Home Valuation Report for This Property
The Home Valuation Report is an in-depth analysis detailing your home's value as well as a comparison with similar homes in the area
Home Values in the Area
Average Home Value in this Area
Purchase History
| Date | Buyer | Sale Price | Title Company |
|---|---|---|---|
| Thomas Larry K | $68,900 | -- | |
| Didot Barbara A | $42,000 | -- |
Source: Public Records
Mortgage History
| Date | Status | Borrower | Loan Amount |
|---|---|---|---|
| Open | Thomas Larry K | $68,864 |
Source: Public Records
Tax History
| Year | Tax Paid | Tax Assessment Tax Assessment Total Assessment is a certain percentage of the fair market value that is determined by local assessors to be the total taxable value of land and additions on the property. | Land | Improvement |
|---|---|---|---|---|
| 2024 | $772 | $32,420 | $12,080 | $20,340 |
| 2023 | $930 | $32,420 | $12,080 | $20,340 |
| 2022 | $990 | $32,420 | $12,080 | $20,340 |
| 2021 | $740 | $24,930 | $9,280 | $15,650 |
| 2020 | $725 | $24,930 | $9,280 | $15,650 |
| 2019 | $729 | $24,930 | $9,280 | $15,650 |
| 2018 | $657 | $22,680 | $9,660 | $13,020 |
| 2017 | $665 | $22,680 | $9,660 | $13,020 |
| 2016 | $658 | $22,680 | $9,660 | $13,020 |
| 2015 | $631 | $21,810 | $9,280 | $12,530 |
| 2014 | $631 | $21,810 | $9,280 | $12,530 |
| 2013 | $633 | $21,810 | $9,280 | $12,530 |
Source: Public Records
Map
Nearby Homes
- 1507 Nicklin Ave
- 1514 Nicklin Ave
- 614 Cherry St
- 1307 Walker St
- 1516 Madison Ave
- 505 Scott St
- 1115 Madison Ave
- 10175 Piqua Lockington Rd
- 1102 Fountain Blvd
- 735 Park Ave
- 508 Park Ave
- 630 Boone St
- 1062 Boone St
- 606 Boone St
- 651 Boone St
- 103 Lakewood Place
- 522 W North St
- 825 W Greene St
- 502 Caldwell St
- 1319 Stratford Dr
Your Personal Tour Guide
Ask me questions while you tour the home.