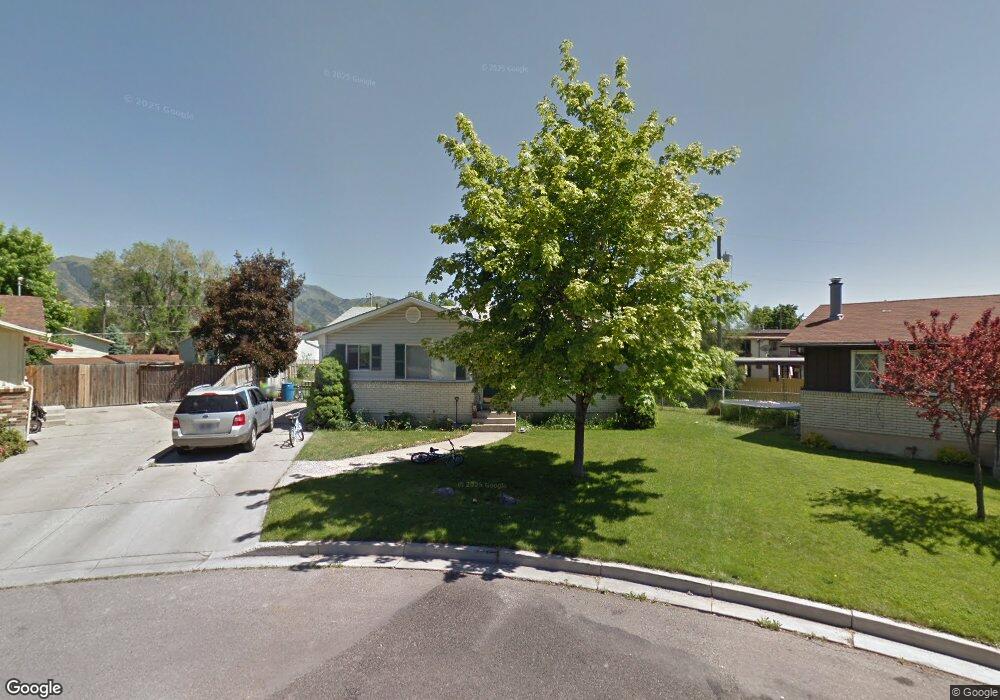
518 W 550 N Logan, UT 84321
Ellis NeighborhoodEstimated Value: $356,000 - $400,000
4
Beds
2
Baths
2,090
Sq Ft
$180/Sq Ft
Est. Value
About This Home
This home is located at 518 W 550 N, Logan, UT 84321 and is currently estimated at $376,369, approximately $180 per square foot. 518 W 550 N is a home located in Cache County with nearby schools including Ellis School, Mount Logan Middle School, and Logan High School.
Ownership History
Date
Name
Owned For
Owner Type
Purchase Details
Closed on
May 19, 2009
Sold by
Johnson Michelle M and Tracy Brown M
Bought by
Johnson Michelle M and Tracy Brown M
Current Estimated Value
Home Financials for this Owner
Home Financials are based on the most recent Mortgage that was taken out on this home.
Original Mortgage
$138,390
Outstanding Balance
$86,825
Interest Rate
4.8%
Mortgage Type
FHA
Estimated Equity
$289,544
Purchase Details
Closed on
Jan 22, 2007
Sold by
Smith Ryan Wesley and Smith Suzanne
Bought by
Johnson Michelle
Home Financials for this Owner
Home Financials are based on the most recent Mortgage that was taken out on this home.
Original Mortgage
$27,200
Interest Rate
6.11%
Mortgage Type
Stand Alone Second
Create a Home Valuation Report for This Property
The Home Valuation Report is an in-depth analysis detailing your home's value as well as a comparison with similar homes in the area
Home Values in the Area
Average Home Value in this Area
Purchase History
| Date | Buyer | Sale Price | Title Company |
|---|---|---|---|
| Johnson Michelle M | -- | Northern Title Company | |
| Johnson Michelle M | -- | Northern Title Company | |
| Johnson Michelle | -- | Cache Title Company |
Source: Public Records
Mortgage History
| Date | Status | Borrower | Loan Amount |
|---|---|---|---|
| Open | Johnson Michelle M | $138,390 | |
| Closed | Johnson Michelle M | $138,390 | |
| Closed | Johnson Michelle | $27,200 | |
| Closed | Johnson Michelle | $108,800 |
Source: Public Records
Tax History
| Year | Tax Paid | Tax Assessment Tax Assessment Total Assessment is a certain percentage of the fair market value that is determined by local assessors to be the total taxable value of land and additions on the property. | Land | Improvement |
|---|---|---|---|---|
| 2025 | $1,740 | $224,985 | $0 | $0 |
| 2024 | $1,796 | $224,985 | $0 | $0 |
| 2023 | $1,874 | $223,775 | $0 | $0 |
| 2022 | $1,686 | $188,030 | $0 | $0 |
| 2021 | $1,587 | $273,360 | $45,000 | $228,360 |
| 2020 | $1,518 | $235,300 | $45,000 | $190,300 |
| 2019 | $1,540 | $228,438 | $45,000 | $183,438 |
| 2018 | $1,480 | $200,456 | $45,000 | $155,456 |
| 2017 | $1,350 | $96,690 | $0 | $0 |
| 2016 | $1,400 | $74,250 | $0 | $0 |
| 2015 | $1,076 | $74,250 | $0 | $0 |
| 2014 | $914 | $69,720 | $0 | $0 |
| 2013 | -- | $69,720 | $0 | $0 |
Source: Public Records
Map
Nearby Homes
Your Personal Tour Guide
Ask me questions while you tour the home.