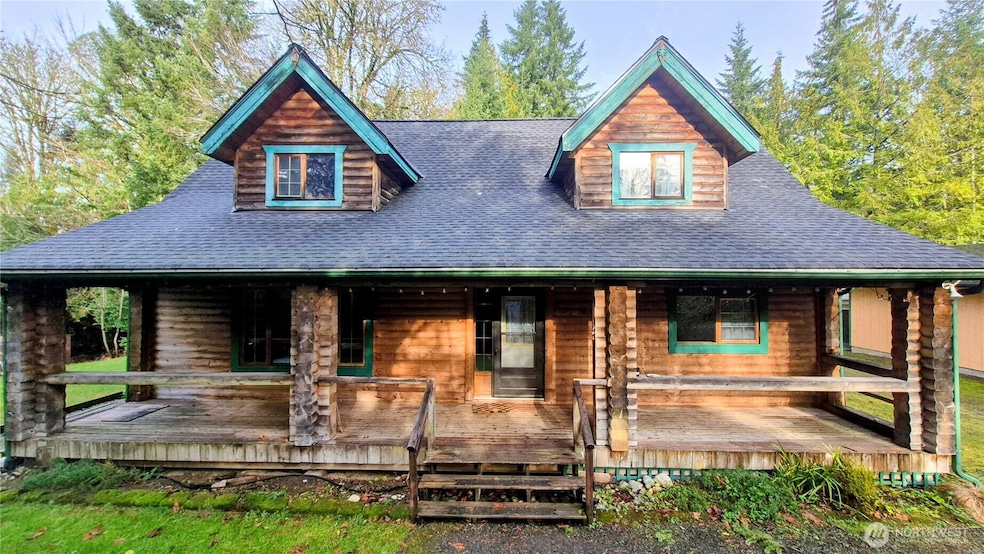
5182 Lars Hansen Rd SE Port Orchard, WA 98367
Estimated payment $3,423/month
Highlights
- RV Access or Parking
- Secluded Lot
- Loft
- Deck
- Vaulted Ceiling
- No HOA
About This Home
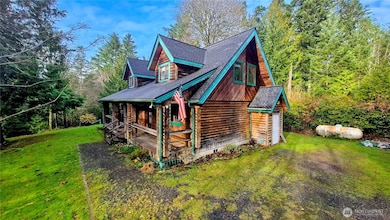
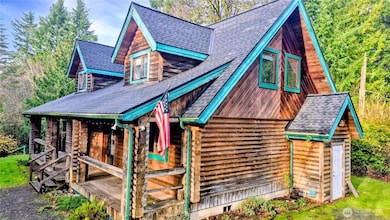
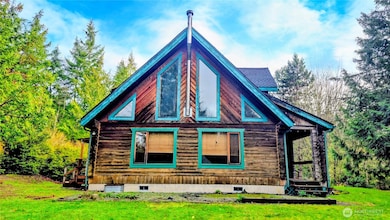
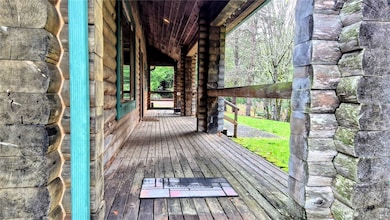
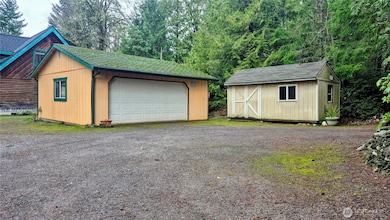
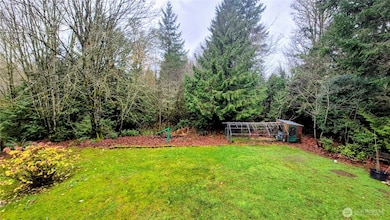
Country living at its finest. Come experience the magic of this beautiful 2 bed 1.75 bath plus bonus room log home in the woods. Set back off a dead end road, you are minutes away from town but feel worlds apart. This home has plenty of parking for guests and toys. Ample storage in the shed and a detached 2 car garage with large parking areas for your RV. Inside you're welcomed with high ceilings and a cozy wood stove to relax and take in the surroundings. 2 bedrooms downstairs and a recently remodeled bathroom on the main floor and a bonus room upstairs with large walk in closet and 3/4 bath that could be used as a primary suite. Close to ferry and highway for easy commute to Seattle or Navy bases. Roof is only 5 years old.
Source: Northwest Multiple Listing Service (NWMLS)
MLS#: 2460584
Home Details
Home Type
- Single Family
Est. Annual Taxes
- $4,156
Year Built
- Built in 1998
Lot Details
- 1.52 Acre Lot
- Street terminates at a dead end
- South Facing Home
- Secluded Lot
- Level Lot
- Property is in good condition
Parking
- 2 Car Detached Garage
- RV Access or Parking
Home Design
- Cabin
- Poured Concrete
- Composition Roof
- Log Siding
Interior Spaces
- 1,672 Sq Ft Home
- 1.5-Story Property
- Vaulted Ceiling
- Wood Burning Fireplace
- Loft
- Storm Windows
- Property Views
Kitchen
- Stove
- Dishwasher
Flooring
- Carpet
- Vinyl
Bedrooms and Bathrooms
- 2 Main Level Bedrooms
- Bathroom on Main Level
Laundry
- Dryer
- Washer
Outdoor Features
- Deck
- Outbuilding
Utilities
- Forced Air Heating System
- Propane
- Well
- Water Heater
- Septic Tank
Community Details
- No Home Owners Association
- South Kitsap Subdivision
Listing and Financial Details
- Down Payment Assistance Available
- Visit Down Payment Resource Website
- Assessor Parcel Number 09230220162006
Map
Home Values in the Area
Average Home Value in this Area
Tax History
| Year | Tax Paid | Tax Assessment Tax Assessment Total Assessment is a certain percentage of the fair market value that is determined by local assessors to be the total taxable value of land and additions on the property. | Land | Improvement |
|---|---|---|---|---|
| 2026 | $4,156 | $484,570 | $114,630 | $369,940 |
| 2025 | $4,156 | $484,570 | $114,630 | $369,940 |
| 2024 | $4,028 | $484,570 | $114,630 | $369,940 |
| 2023 | $3,999 | $484,570 | $114,630 | $369,940 |
| 2022 | $3,856 | $391,090 | $91,710 | $299,380 |
| 2021 | $3,595 | $345,070 | $81,880 | $263,190 |
| 2020 | $3,593 | $335,610 | $71,950 | $263,660 |
| 2019 | $3,033 | $311,900 | $66,770 | $245,130 |
| 2018 | $3,231 | $257,900 | $60,440 | $197,460 |
| 2017 | $2,757 | $257,900 | $60,440 | $197,460 |
| 2016 | $2,701 | $231,190 | $57,560 | $173,630 |
| 2015 | $2,618 | $227,220 | $57,560 | $169,660 |
| 2014 | -- | $213,240 | $65,000 | $148,240 |
| 2013 | -- | $213,240 | $65,000 | $148,240 |
Property History
| Date | Event | Price | List to Sale | Price per Sq Ft |
|---|---|---|---|---|
| 12/11/2025 12/11/25 | For Sale | $585,000 | -- | $350 / Sq Ft |
Purchase History
| Date | Type | Sale Price | Title Company |
|---|---|---|---|
| Interfamily Deed Transfer | -- | Stewart Title Of Kitsap Co | |
| Interfamily Deed Transfer | -- | Land Title Company |
Mortgage History
| Date | Status | Loan Amount | Loan Type |
|---|---|---|---|
| Closed | $260,000 | Purchase Money Mortgage | |
| Closed | $207,000 | Purchase Money Mortgage |
Source: Northwest Multiple Listing Service (NWMLS)
MLS Number: 2460584
APN: 092302-2-016-2006
Disclaimer: Certain information contained herein is derived from information provided by parties other than Homes.com. All information provided is deemed reliable, but is not guaranteed to be accurate and should be independently verified.
![]() All data is obtained from various sources and may not have been verified by broker or MLS GRID. Supplied Open House Information is subject to change without notice. All information should be independently reviewed and verified for accuracy. Properties may or may not be listed by the office/agent presenting the information. Listing information is provided by the Northwest Multiple Listing Service (NWMLS). Property information is based on available data that may include MLS information, county records, and other sources. Listings marked with the 3 tree icon and provided by NWMLS. All properties are subject to prior sale or withdrawal. IDX information is provided exclusively for consumers’ personal noncommercial use, that it may not be used for any purpose other than to identify prospective properties consumers may be interested in purchasing, that the data is deemed reliable but is not guaranteed by MLS GRID. ©2025 NWMLS.
All data is obtained from various sources and may not have been verified by broker or MLS GRID. Supplied Open House Information is subject to change without notice. All information should be independently reviewed and verified for accuracy. Properties may or may not be listed by the office/agent presenting the information. Listing information is provided by the Northwest Multiple Listing Service (NWMLS). Property information is based on available data that may include MLS information, county records, and other sources. Listings marked with the 3 tree icon and provided by NWMLS. All properties are subject to prior sale or withdrawal. IDX information is provided exclusively for consumers’ personal noncommercial use, that it may not be used for any purpose other than to identify prospective properties consumers may be interested in purchasing, that the data is deemed reliable but is not guaranteed by MLS GRID. ©2025 NWMLS.
Based on information submitted to the MLS GRID
- 6724 SE Sedgwick Rd
- 4609 Forest View Ln SE
- 6223 Ebbert Dr SE
- 3333 Locker Rd SE
- 3570 Menzies Rd SE
- 4554 Westway Dr SE
- 3188 Hinkley Rd SE
- 6643 Richards Ave SE
- 3040 Banner Rd SE
- 4920 Peterson Rd SE
- 8400 SE Berry St
- 0 SE Berry St
- 4440 Harper Hill Rd SE
- 9300 Rustic Rock Ln SE
- 6556 Mariposa Ln SE
- 2451 Mcgregor Dr SE
- 4646 SE Green Shores Dr
- 5544 Clover Valley Rd SE
- 0 Lot 3 SE Yeshua Ln
- 2863 Rocky Creek Ln SE
- 4698 SE Conifer Park Dr
- 3990 Starboard Ln SE
- 8582 Long Lake Rd SE
- 3418 SE Navigation Ln
- 4106 Madrona Dr SE
- 7265 E Harrison St Unit A
- 1665 Payseno Ln SE
- 1410 Wendell Ave SE
- 3410-3420 Orlando St
- 2192 SE Sedgwick Rd
- 3100 SE Orlando St
- 3300 Valentine Ln SE
- 1481 SE Blueberry Rd
- 10829 Olalla Valley Rd SE
- 1621 Plisko Ln
- 1800 Sidney Ave
- 4999 Sidney Rd SW
- 414 SW Hayworth Dr
- 487 Mansfield Ct SW
- 811 Hayward Ave
