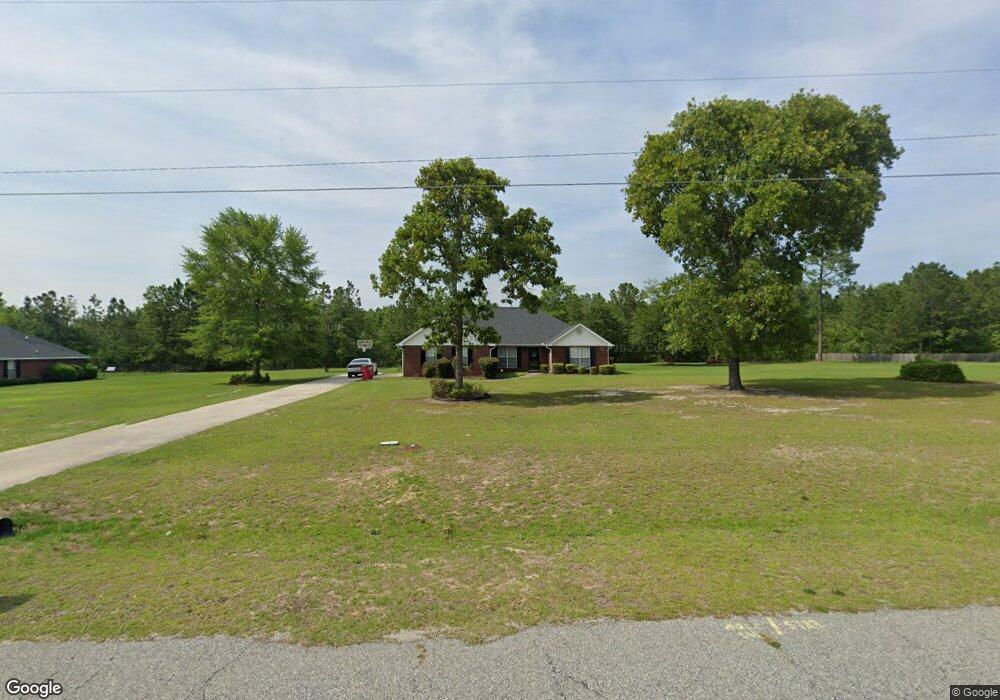
5183 Sand Hill Cir N Lizella, GA 31052
Estimated Value: $232,000 - $276,306
4
Beds
3
Baths
2,019
Sq Ft
$125/Sq Ft
Est. Value
About This Home
This home is located at 5183 Sand Hill Cir N, Lizella, GA 31052 and is currently estimated at $253,077, approximately $125 per square foot. 5183 Sand Hill Cir N is a home located in Bibb County with nearby schools including Skyview Elementary School, Rutland Middle School, and Rutland High School.
Ownership History
Date
Name
Owned For
Owner Type
Purchase Details
Closed on
May 13, 2011
Sold by
Stephens Billy
Bought by
Stephens Billy and Stephens Annie
Current Estimated Value
Home Financials for this Owner
Home Financials are based on the most recent Mortgage that was taken out on this home.
Original Mortgage
$112,084
Outstanding Balance
$77,857
Interest Rate
4.87%
Mortgage Type
FHA
Estimated Equity
$175,220
Purchase Details
Closed on
Nov 30, 2005
Sold by
Lowe Moon Forest Products Inc
Bought by
Tetterton William D and Tetterton Frances G
Home Financials for this Owner
Home Financials are based on the most recent Mortgage that was taken out on this home.
Original Mortgage
$206,910
Interest Rate
8.6%
Mortgage Type
Adjustable Rate Mortgage/ARM
Purchase Details
Closed on
Aug 20, 2004
Purchase Details
Closed on
Jan 26, 2004
Purchase Details
Closed on
Oct 13, 2000
Create a Home Valuation Report for This Property
The Home Valuation Report is an in-depth analysis detailing your home's value as well as a comparison with similar homes in the area
Home Values in the Area
Average Home Value in this Area
Purchase History
| Date | Buyer | Sale Price | Title Company |
|---|---|---|---|
| Stephens Billy | -- | None Available | |
| Stephens Billy | $119,250 | None Available | |
| Tetterton William D | $229,900 | None Avilebel | |
| -- | $179,900 | -- | |
| -- | -- | -- | |
| -- | $155,000 | -- |
Source: Public Records
Mortgage History
| Date | Status | Borrower | Loan Amount |
|---|---|---|---|
| Open | Stephens Billy | $112,084 | |
| Previous Owner | Tetterton William D | $206,910 |
Source: Public Records
Tax History Compared to Growth
Tax History
| Year | Tax Paid | Tax Assessment Tax Assessment Total Assessment is a certain percentage of the fair market value that is determined by local assessors to be the total taxable value of land and additions on the property. | Land | Improvement |
|---|---|---|---|---|
| 2024 | $2,012 | $79,216 | $7,200 | $72,016 |
| 2023 | $1,692 | $66,630 | $7,200 | $59,430 |
| 2022 | $2,067 | $59,702 | $8,200 | $51,502 |
| 2021 | $2,269 | $59,702 | $8,200 | $51,502 |
| 2020 | $2,318 | $59,702 | $8,200 | $51,502 |
| 2019 | $2,438 | $62,280 | $8,200 | $54,080 |
| 2018 | $3,151 | $49,555 | $8,200 | $41,355 |
| 2017 | $1,857 | $49,555 | $8,200 | $41,355 |
| 2016 | $1,714 | $49,555 | $8,200 | $41,355 |
| 2015 | $2,427 | $49,555 | $8,200 | $41,355 |
| 2014 | $2,430 | $49,555 | $8,200 | $41,355 |
Source: Public Records
Map
Nearby Homes
- 7135 Bethel Church Rd
- 4360 Chant Ct
- 6403 Pine Bloom Place
- 6982 Knoxville Rd
- 6866 Knoxville Rd
- 229 Briar Creek Way
- 3636 W Point Cir
- 6100 Clayts Cir
- 215 Little Hickory Dr
- 444 Burlington Dr
- 430 Burlington Dr
- 438 Burlington Dr
- 434 Burlington Dr
- 442 Burlington Dr
- 426 Burlington Dr
- 6219 Clayts Cir
- 218 Jason Way
- 142 Tobee Dr
- 3490 Tidwell Rd
- 4009 Rogers Rd
- 5187 Sand Hill Cir N
- 5179 Sand Hill Cir N
- 5182 Sand Hill Cir N
- 5186 Sand Hill Cir N
- 5178 Sand Hill Cir N
- 5191 Sand Hill Cir N
- N Sand Hill Cir N
- 7025 Sandusky Dr
- 5190 Sand Hill Cir N
- 7029 Sandusky Dr
- 7021 Sandusky Dr
- 5175 Sand Hill Cir N
- 5195 Sand Hill Cir N
- 7033 Sandusky Dr
- 5174 Sand Hill Cir N
- 0 Sandusky Dr Unit 7225990
- 0 Sandusky Dr Unit 7184681
- 0 Sandusky Dr
- 5200 Sand Hill Cir N
- 7024 Sandusky Dr