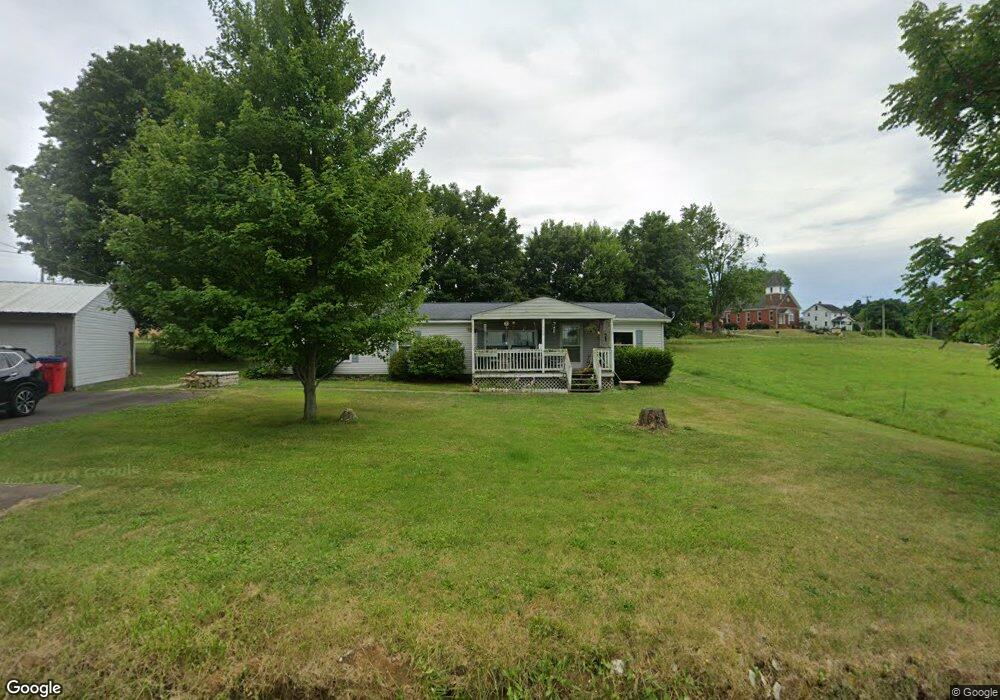
5186 Diamond St NE Canton, OH 44721
Estimated Value: $140,000 - $256,000
3
Beds
2
Baths
1,620
Sq Ft
$106/Sq Ft
Est. Value
About This Home
This home is located at 5186 Diamond St NE, Canton, OH 44721 and is currently estimated at $170,961, approximately $105 per square foot. 5186 Diamond St NE is a home located in Stark County with nearby schools including Middlebranch Elementary School, Oakwood Middle School, and GlenOak High School.
Ownership History
Date
Name
Owned For
Owner Type
Purchase Details
Closed on
Apr 28, 2023
Sold by
Clark Deborah
Bought by
Amcop Mortgage Ltd and Cold Fionancial Services
Current Estimated Value
Home Financials for this Owner
Home Financials are based on the most recent Mortgage that was taken out on this home.
Original Mortgage
$92,000
Outstanding Balance
$89,538
Interest Rate
6.6%
Mortgage Type
New Conventional
Estimated Equity
$81,423
Purchase Details
Closed on
Jul 10, 2013
Sold by
Clark Douglas and Clark Deborah
Bought by
Clark Deborah and Clark Douglas
Purchase Details
Closed on
Mar 10, 1998
Sold by
Cameron Frederick W
Bought by
Clark Douglas and Clark Deborah
Home Financials for this Owner
Home Financials are based on the most recent Mortgage that was taken out on this home.
Original Mortgage
$59,578
Interest Rate
7.08%
Mortgage Type
New Conventional
Purchase Details
Closed on
Apr 27, 1992
Create a Home Valuation Report for This Property
The Home Valuation Report is an in-depth analysis detailing your home's value as well as a comparison with similar homes in the area
Home Values in the Area
Average Home Value in this Area
Purchase History
| Date | Buyer | Sale Price | Title Company |
|---|---|---|---|
| Amcop Mortgage Ltd | -- | None Listed On Document | |
| Clark Deborah | -- | None Available | |
| Clark Douglas | $15,000 | -- | |
| -- | $8,000 | -- |
Source: Public Records
Mortgage History
| Date | Status | Borrower | Loan Amount |
|---|---|---|---|
| Open | Amcop Mortgage Ltd | $92,000 | |
| Previous Owner | Clark Douglas | $59,578 |
Source: Public Records
Tax History Compared to Growth
Tax History
| Year | Tax Paid | Tax Assessment Tax Assessment Total Assessment is a certain percentage of the fair market value that is determined by local assessors to be the total taxable value of land and additions on the property. | Land | Improvement |
|---|---|---|---|---|
| 2025 | -- | $38,580 | $5,290 | $33,290 |
| 2024 | -- | $38,580 | $5,290 | $33,290 |
| 2023 | $665 | $25,340 | $4,620 | $20,720 |
| 2022 | $595 | $23,070 | $4,620 | $18,450 |
| 2021 | $595 | $23,070 | $4,620 | $18,450 |
| 2020 | $526 | $19,920 | $4,170 | $15,750 |
| 2019 | $834 | $19,930 | $4,170 | $15,760 |
| 2018 | $910 | $19,930 | $4,170 | $15,760 |
| 2017 | $978 | $19,680 | $3,570 | $16,110 |
| 2016 | $942 | $19,680 | $3,570 | $16,110 |
| 2015 | $600 | $19,190 | $3,570 | $15,620 |
| 2014 | $945 | $18,590 | $3,470 | $15,120 |
| 2013 | $476 | $18,590 | $3,470 | $15,120 |
Source: Public Records
Map
Nearby Homes
- 7875 Bentler Ave NE
- 3681 Werner Church Rd NE
- 3404 Wicker St NE
- 3426 Stoneleigh Rd NE
- 0 Fiddler Court Cir NE
- 3339 Boettler St NE
- 3151 Knollridge Cir NE
- 2934 William St NE
- 3461 Donegal Dr NE
- 7106 Woodell Ave NE
- 7086 Woodell Ave NE
- 8033 Maxim Cir NE
- 8098 Diamond Park Ave NE
- 2623 Notre Dame St NE
- 3788 Psolla St NE
- 6914 Stonecreek Ave NE
- 3625 Alpine St NE
- 3240 Eastern St NE
- Elder Plan at Sparwood Farms
- Aspen Plan at Sparwood Farms
- 8151 Diamond St NE
- 8133 Diamond St NE
- 5125 Diamond St NE
- 5110 Werner Church Rd NE
- 5076 Diamond St NE
- 5174 Werner Church Rd NE
- 5092 Werner Church Rd NE
- 5172 Werner Church Rd NE
- 8530 Bentler Ave NE
- 5069 Werner Church Rd NE
- 5041 Werner Church Rd NE
- 5032 Werner Church Rd NE
- 8107 Bentler Ave NE
- 3926 Werner Church Rd NE
- 3891 Werner Church Rd NE
- 3920 Werner Church Rd NE
- 3291 Stoneleigh Rd NE
- 7538 Woodway Rd NE
- 3873 Werner Church Rd NE
- 5526 Werner Church Rd NE