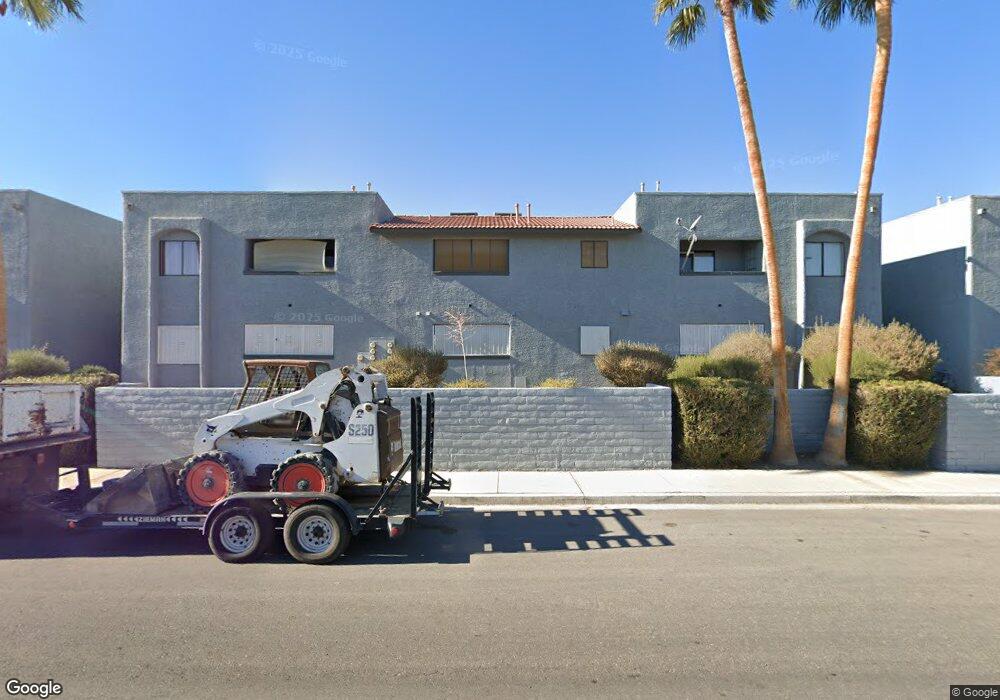
5187 Caliente St Unit 91 Las Vegas, NV 89119
University District NeighborhoodEstimated Value: $126,000 - $191,000
2
Beds
2
Baths
994
Sq Ft
$174/Sq Ft
Est. Value
About This Home
This home is located at 5187 Caliente St Unit 91, Las Vegas, NV 89119 and is currently estimated at $172,805, approximately $173 per square foot. 5187 Caliente St Unit 91 is a home located in Clark County with nearby schools including Gene Ward Elementary School, Jack Dailey Elementary School, and Helen C. Cannon Junior High School.
Ownership History
Date
Name
Owned For
Owner Type
Purchase Details
Closed on
Sep 28, 2017
Sold by
Noehl Justin L
Bought by
Noehl Gia Bang
Current Estimated Value
Purchase Details
Closed on
Sep 27, 2017
Sold by
Moore Jeannie
Bought by
Noelhl Gia Bang
Purchase Details
Closed on
Apr 25, 2007
Sold by
Camilli Hien B
Bought by
Moore Jeannie
Home Financials for this Owner
Home Financials are based on the most recent Mortgage that was taken out on this home.
Original Mortgage
$85,000
Interest Rate
6.11%
Mortgage Type
Unknown
Purchase Details
Closed on
Jun 10, 2003
Sold by
Hummel Susan L and Huffman Susan
Bought by
Camilli Hien B
Home Financials for this Owner
Home Financials are based on the most recent Mortgage that was taken out on this home.
Original Mortgage
$55,200
Interest Rate
5.37%
Mortgage Type
Unknown
Create a Home Valuation Report for This Property
The Home Valuation Report is an in-depth analysis detailing your home's value as well as a comparison with similar homes in the area
Home Values in the Area
Average Home Value in this Area
Purchase History
| Date | Buyer | Sale Price | Title Company |
|---|---|---|---|
| Noehl Gia Bang | -- | Old Republic Title | |
| Noelhl Gia Bang | $75,000 | Old Republic Title Co | |
| Moore Jeannie | $142,000 | Old Republic Title Co Of Nv | |
| Camilli Hien B | $69,000 | Old Republic Title Company |
Source: Public Records
Mortgage History
| Date | Status | Borrower | Loan Amount |
|---|---|---|---|
| Previous Owner | Moore Jeannie | $85,000 | |
| Previous Owner | Camilli Hien B | $55,200 |
Source: Public Records
Tax History Compared to Growth
Tax History
| Year | Tax Paid | Tax Assessment Tax Assessment Total Assessment is a certain percentage of the fair market value that is determined by local assessors to be the total taxable value of land and additions on the property. | Land | Improvement |
|---|---|---|---|---|
| 2025 | $535 | $32,314 | $16,450 | $15,864 |
| 2024 | $534 | $32,314 | $16,450 | $15,864 |
| 2023 | $534 | $33,208 | $18,200 | $15,008 |
| 2022 | $460 | $30,173 | $16,100 | $14,073 |
| 2021 | $426 | $25,693 | $11,900 | $13,793 |
| 2020 | $393 | $24,040 | $10,150 | $13,890 |
| 2019 | $368 | $21,318 | $7,350 | $13,968 |
| 2018 | $351 | $19,026 | $5,250 | $13,776 |
| 2017 | $561 | $19,137 | $4,900 | $14,237 |
| 2016 | $330 | $17,995 | $3,850 | $14,145 |
| 2015 | $328 | $15,123 | $3,500 | $11,623 |
| 2014 | $318 | $10,511 | $3,500 | $7,011 |
Source: Public Records
Map
Nearby Homes
- 5219 Caliente St Unit 11
- 1688 Mapleton Ln
- 1751 E Reno Ave Unit 206
- 1751 E Reno Ave Unit 217
- 1751 E Reno Ave Unit 128
- 1673 Caliente Ct
- 5260 Dickens Dr
- 5049 Spencer St Unit D
- 5272 Dickens Dr
- 5343 Tamarus St
- 5078 Spencer St Unit D
- 5064 Spencer St Unit B
- 1375 E Hacienda Ave Unit 201
- 5015 Spencer St Unit C
- 5403 Tamarus St
- 5060 Newport Cove Dr Unit B
- 5060 Newport Cove Dr Unit C
- 5445 Caliente St
- 5368 Escondido St
- 4941 Newport Cove Dr Unit B
- 5187 Caliente St Unit 92
- 5187 Caliente St Unit 95
- 5187 Caliente St Unit 96
- 5187 Caliente St Unit 93
- 5187 Caliente St Unit 94
- 5191 Caliente St Unit 82
- 5191 Caliente St Unit 83
- 5191 Caliente St Unit 81
- 5183 Caliente St Unit 102
- 5183 Caliente St Unit 101
- 5183 Caliente St Unit 103
- 5183 Caliente St Unit 104
- 5195 Caliente St Unit 72
- 5195 Caliente St Unit 74
- 5195 Caliente St Unit 73
- 5179 Caliente St Unit 113
- 5179 Caliente St Unit 114
- 5179 Caliente St Unit 111
- 5179 Caliente St Unit 112
- 5182 Caliente St