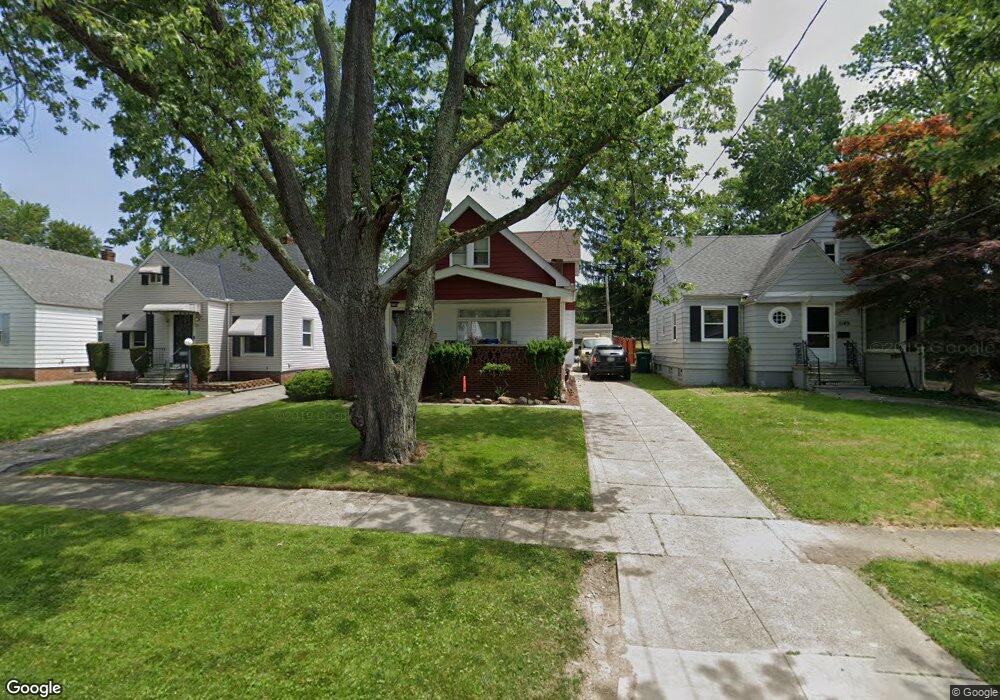
5187 Erwin St Maple Heights, OH 44137
Estimated Value: $113,131 - $128,000
2
Beds
2
Baths
1,036
Sq Ft
$116/Sq Ft
Est. Value
About This Home
This home is located at 5187 Erwin St, Maple Heights, OH 44137 and is currently estimated at $120,283, approximately $116 per square foot. 5187 Erwin St is a home located in Cuyahoga County with nearby schools including Abraham Lincoln Elementary School, Rockside/ J.F. Kennedy School, and Barack Obama School.
Ownership History
Date
Name
Owned For
Owner Type
Purchase Details
Closed on
Jul 8, 2015
Sold by
Johnson Vernicki
Bought by
Parker Willie and Parker Evelyn Renee
Current Estimated Value
Purchase Details
Closed on
Jan 6, 2004
Sold by
Nemec Deborah and Nemec Helen A
Bought by
Johnson Vernicki and Johnson Vernicki L
Home Financials for this Owner
Home Financials are based on the most recent Mortgage that was taken out on this home.
Original Mortgage
$78,000
Interest Rate
5.62%
Mortgage Type
Purchase Money Mortgage
Purchase Details
Closed on
Sep 20, 1995
Sold by
Phillips Holly M
Bought by
Dufour Frank W
Purchase Details
Closed on
Oct 26, 1984
Sold by
Nemec John J and Nemec Helen A
Bought by
Nemec John J
Purchase Details
Closed on
Jan 1, 1975
Bought by
Nemec John J and Nemec Helen A
Create a Home Valuation Report for This Property
The Home Valuation Report is an in-depth analysis detailing your home's value as well as a comparison with similar homes in the area
Home Values in the Area
Average Home Value in this Area
Purchase History
| Date | Buyer | Sale Price | Title Company |
|---|---|---|---|
| Parker Willie | $7,071 | None Available | |
| Johnson Vernicki | $78,000 | Real Estate Title Service Co | |
| Dufour Frank W | $54,708 | -- | |
| Nemec John J | -- | -- | |
| Nemec John J | -- | -- |
Source: Public Records
Mortgage History
| Date | Status | Borrower | Loan Amount |
|---|---|---|---|
| Previous Owner | Johnson Vernicki | $78,000 | |
| Closed | Dufour Frank W | $0 |
Source: Public Records
Tax History
| Year | Tax Paid | Tax Assessment Tax Assessment Total Assessment is a certain percentage of the fair market value that is determined by local assessors to be the total taxable value of land and additions on the property. | Land | Improvement |
|---|---|---|---|---|
| 2024 | $3,146 | $34,790 | $6,790 | $28,000 |
| 2023 | $2,222 | $20,550 | $4,100 | $16,450 |
| 2022 | $2,214 | $20,545 | $4,095 | $16,450 |
| 2021 | $2,358 | $20,550 | $4,100 | $16,450 |
| 2020 | $2,020 | $15,580 | $3,120 | $12,460 |
| 2019 | $2,009 | $44,500 | $8,900 | $35,600 |
| 2018 | $1,998 | $15,580 | $3,120 | $12,460 |
| 2017 | $1,804 | $13,450 | $2,910 | $10,540 |
| 2016 | $1,897 | $13,450 | $2,910 | $10,540 |
| 2015 | $5,235 | $13,450 | $2,910 | $10,540 |
| 2014 | $5,235 | $14,780 | $3,190 | $11,590 |
Source: Public Records
Map
Nearby Homes
- 5219 Joseph St
- 5239 Arch St
- 5100 Erwin St
- 5150 Arch St
- 5177 Cato St
- 18704 Longview Ave
- 5194 Homewood Ave
- 18851 Raymond St
- 17914 Libby Rd
- 5357 Beechwood Ave
- 5231 Philip Ave
- 5031 Cato St
- 5165 Camden Rd
- 18909 Maple Heights Blvd
- 17916 North Blvd
- 5246 Philip Ave
- 5082 Philip Ave
- 5409 Hollywood Ave
- 5212 Catherine St
- 19520 Maple Heights Blvd
Your Personal Tour Guide
Ask me questions while you tour the home.