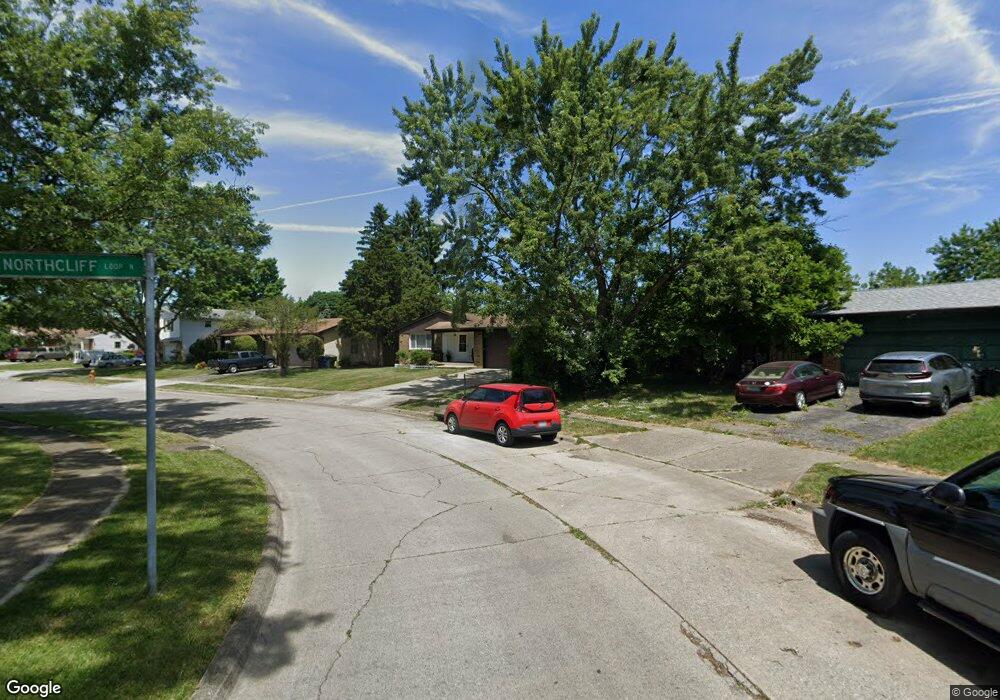
5187 Northcliff Loop E Columbus, OH 43229
Forest Park East NeighborhoodEstimated Value: $352,000 - $360,000
4
Beds
3
Baths
2,342
Sq Ft
$151/Sq Ft
Est. Value
About This Home
This home is located at 5187 Northcliff Loop E, Columbus, OH 43229 and is currently estimated at $354,716, approximately $151 per square foot. 5187 Northcliff Loop E is a home located in Franklin County with nearby schools including Parkmoor Elementary School, Woodward Park Middle School, and Northland High School.
Ownership History
Date
Name
Owned For
Owner Type
Purchase Details
Closed on
Aug 27, 2003
Sold by
Kerry Michael A and Kerry Melissa F
Bought by
Thomas Ajara E
Current Estimated Value
Purchase Details
Closed on
May 30, 1997
Sold by
Sanfillipo Mary T
Bought by
Kerry Michael A and Kerry Melissa F
Purchase Details
Closed on
Apr 13, 1990
Create a Home Valuation Report for This Property
The Home Valuation Report is an in-depth analysis detailing your home's value as well as a comparison with similar homes in the area
Home Values in the Area
Average Home Value in this Area
Purchase History
| Date | Buyer | Sale Price | Title Company |
|---|---|---|---|
| Thomas Ajara E | $148,000 | Real Living Title | |
| Thomas Ajara E | $148,000 | Real Living Title | |
| Kerry Michael A | $119,500 | Capital Title | |
| Kerry Michael A | $119,500 | Capital Title | |
| -- | $92,500 | -- | |
| -- | $92,500 | -- |
Source: Public Records
Tax History
| Year | Tax Paid | Tax Assessment Tax Assessment Total Assessment is a certain percentage of the fair market value that is determined by local assessors to be the total taxable value of land and additions on the property. | Land | Improvement |
|---|---|---|---|---|
| 2025 | $4,577 | $101,990 | $22,680 | $79,310 |
| 2024 | $4,577 | $101,990 | $22,680 | $79,310 |
| 2023 | $4,519 | $101,990 | $22,680 | $79,310 |
| 2022 | $3,814 | $73,540 | $15,820 | $57,720 |
| 2021 | $3,821 | $73,540 | $15,820 | $57,720 |
| 2020 | $3,811 | $73,260 | $15,820 | $57,440 |
| 2019 | $3,258 | $53,700 | $11,730 | $41,970 |
| 2018 | $2,980 | $53,700 | $11,730 | $41,970 |
| 2017 | $3,120 | $53,700 | $11,730 | $41,970 |
| 2016 | $2,984 | $45,050 | $9,910 | $35,140 |
| 2015 | $2,709 | $45,050 | $9,910 | $35,140 |
| 2014 | $2,716 | $45,050 | $9,910 | $35,140 |
| 2013 | $1,471 | $49,490 | $10,430 | $39,060 |
Source: Public Records
Map
Nearby Homes
- 1905 Denise Dr
- 4979 Lyle Rd
- 1638 Arrowood Loop N
- 5485 Tamarack Blvd
- 5486 Pine Bluff Rd
- 1705 Ivyhill Loop S
- 2236 Strimple Ave
- 2251 Tuliptree Ave
- 4885 Northtowne Blvd
- 2259 Tuliptree Ave
- 4857 Tamarack Blvd
- 5458 Sumac Loop S
- 1469 Sandalwood Place
- 1687 Brookfield Square S
- 5004 Julie Place
- 2294 Teakwood Dr
- 4735 Heatherton Dr
- 4714 Ascot Dr
- 4923 Karl Rd Unit 4925
- 5491 Parkshire Dr Unit 5491
- 1890 Northcliff Loop N
- 1898 Northcliff Loop N
- 5182 Northcliff Loop E
- 1882 Northcliff Loop N
- 1889 Northcliff Loop N
- 1874 Northcliff Loop N
- 5174 Northcliff Loop E
- 5167 Northcliff Loop E
- 1873 Northcliff Loop N
- 5166 Northcliff Loop E
- 5174 Northcliff Loop W
- 5159 Northcliff Loop E
- 1866 Northcliff Loop N
- 5174 Northcliff Loop N
- 5169 Forestwood Rd
- 5175 Forestwood Rd
- 5158 Northcliff Loop E
- 5161 Forestwood Rd
- 5166 Northcliff Loop W
- 5151 Northcliff Loop E
Your Personal Tour Guide
Ask me questions while you tour the home.