Estimated Value: $181,000 - $238,000
4
Beds
2
Baths
1,989
Sq Ft
$106/Sq Ft
Est. Value
About This Home
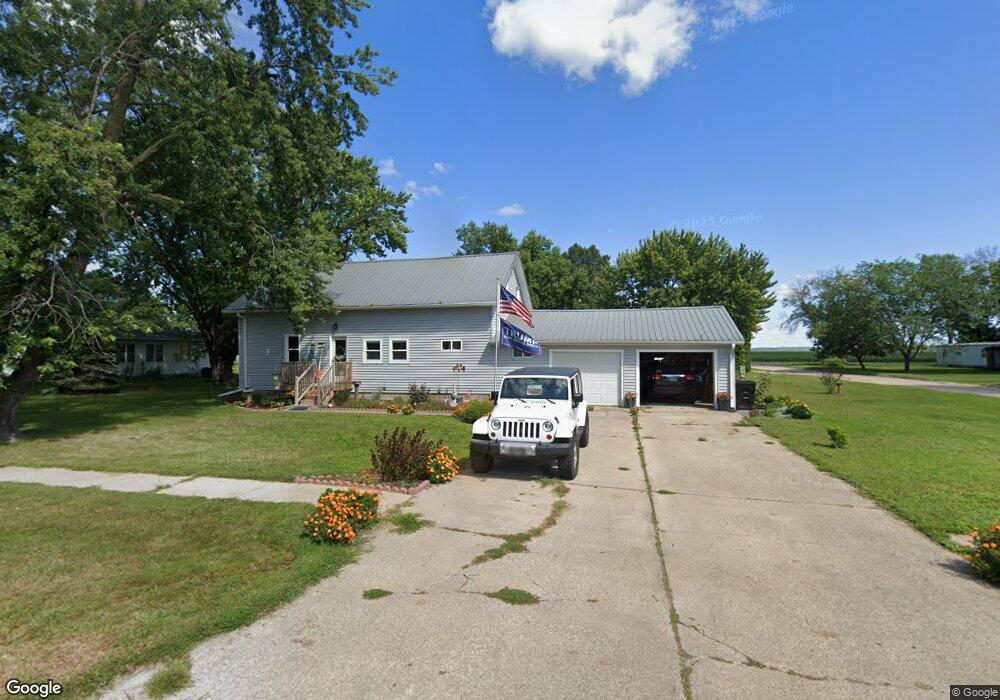
This home is located at 519 3rd St, Onawa, IA 51040 and is currently estimated at $209,840, approximately $105 per square foot. 519 3rd St is a home located in Monona County with nearby schools including West Monona Elementary School, West Monona Middle School, and West Monona High School.
Ownership History
Date
Name
Owned For
Owner Type
Purchase Details
Closed on
Sep 13, 2022
Sold by
Mf Investment Group Llc
Bought by
Herbold Linda J
Current Estimated Value
Purchase Details
Closed on
Nov 26, 2021
Sold by
Fletcher Roger R
Bought by
Mf Investment Group Llc
Home Financials for this Owner
Home Financials are based on the most recent Mortgage that was taken out on this home.
Original Mortgage
$105,000
Interest Rate
3.05%
Mortgage Type
Construction
Purchase Details
Closed on
Jan 19, 2021
Sold by
Fletcher Raymond E
Bought by
Fletcher Roger
Create a Home Valuation Report for This Property
The Home Valuation Report is an in-depth analysis detailing your home's value as well as a comparison with similar homes in the area
Home Values in the Area
Average Home Value in this Area
Purchase History
| Date | Buyer | Sale Price | Title Company |
|---|---|---|---|
| Herbold Linda J | $200,000 | -- | |
| Mf Investment Group Llc | $72,500 | None Listed On Document | |
| Fletcher Roger | $50,000 | None Listed On Document |
Source: Public Records
Mortgage History
| Date | Status | Borrower | Loan Amount |
|---|---|---|---|
| Previous Owner | Mf Investment Group Llc | $105,000 |
Source: Public Records
Tax History
| Year | Tax Paid | Tax Assessment Tax Assessment Total Assessment is a certain percentage of the fair market value that is determined by local assessors to be the total taxable value of land and additions on the property. | Land | Improvement |
|---|---|---|---|---|
| 2024 | $1,866 | $149,396 | $13,866 | $135,530 |
| 2023 | $24 | $149,396 | $13,866 | $135,530 |
| 2022 | $1,360 | $69,895 | $0 | $0 |
| 2021 | $1,138 | $66,946 | $13,866 | $53,080 |
| 2020 | $820 | $66,946 | $13,866 | $53,080 |
| 2019 | $820 | $50,741 | $0 | $0 |
| 2018 | $790 | $50,741 | $0 | $0 |
| 2017 | $790 | $48,325 | $0 | $0 |
| 2016 | $762 | $48,325 | $0 | $0 |
| 2015 | $746 | $42,765 | $0 | $0 |
| 2014 | $646 | $42,765 | $0 | $0 |
Source: Public Records
Map
Nearby Homes
Your Personal Tour Guide
Ask me questions while you tour the home.