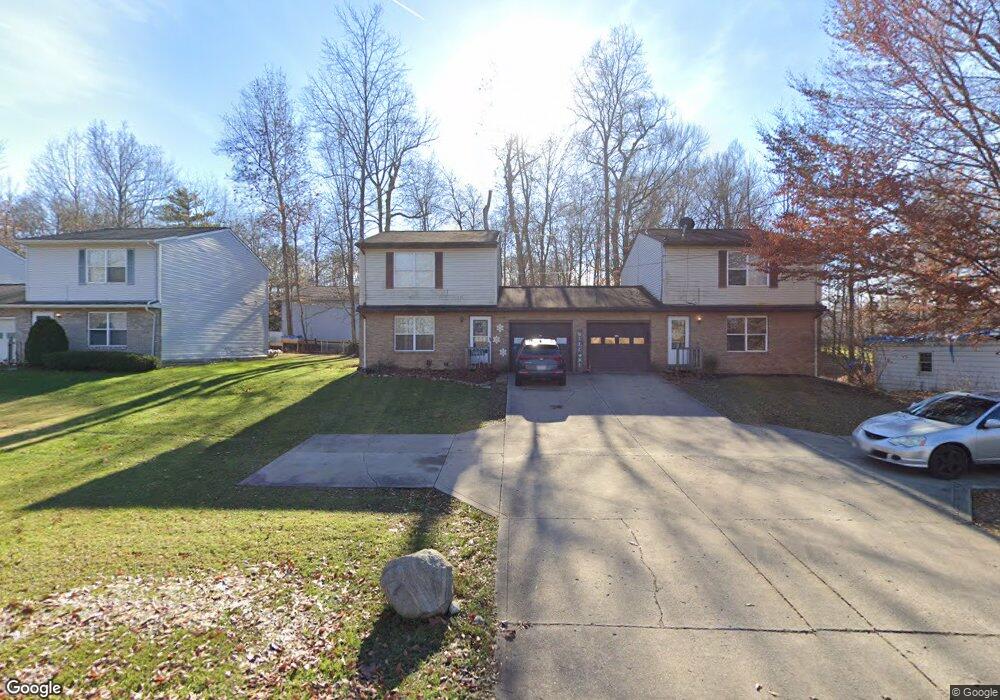
519-521 Straub Rd W Mansfield, OH 44904
Estimated Value: $229,000 - $263,609
4
Beds
3
Baths
2,240
Sq Ft
$107/Sq Ft
Est. Value
About This Home
This home is located at 519-521 Straub Rd W, Mansfield, OH 44904 and is currently estimated at $239,902, approximately $107 per square foot. 519-521 Straub Rd W is a home located in Richland County with nearby schools including Madison High School, Mansfield Christian School, and Discovery School.
Ownership History
Date
Name
Owned For
Owner Type
Purchase Details
Closed on
Mar 1, 2017
Sold by
Cobian Jose and Ruelas Maria
Bought by
Cobian Properties Llc
Current Estimated Value
Purchase Details
Closed on
Nov 21, 2016
Sold by
Brown Michael A
Bought by
Cobian Jose and Ruelas Maria
Home Financials for this Owner
Home Financials are based on the most recent Mortgage that was taken out on this home.
Original Mortgage
$50,000
Interest Rate
3.47%
Mortgage Type
New Conventional
Purchase Details
Closed on
Oct 28, 2008
Sold by
Dechert William and Dechert Janice
Bought by
Bailey Mark D
Purchase Details
Closed on
Oct 26, 2008
Sold by
Pailey Mark D
Bought by
Brown Michael A
Purchase Details
Closed on
Jul 30, 2001
Sold by
Dechert William
Bought by
Gray Alan J and Gray Shirley L
Purchase Details
Closed on
Jun 1, 2001
Sold by
Dechert William
Bought by
Bailey Luther and Bailey Opal M
Purchase Details
Closed on
Jul 26, 1993
Sold by
Vaneff John
Bought by
Brown Michael A
Create a Home Valuation Report for This Property
The Home Valuation Report is an in-depth analysis detailing your home's value as well as a comparison with similar homes in the area
Home Values in the Area
Average Home Value in this Area
Purchase History
| Date | Buyer | Sale Price | Title Company |
|---|---|---|---|
| Cobian Properties Llc | -- | None Available | |
| Cobian Jose | $115,000 | Southern Title | |
| Bailey Mark D | $143,000 | Chicago Title | |
| Brown Michael A | $107,500 | Chicago Title | |
| Gray Alan J | $92,000 | -- | |
| Bailey Luther | $93,000 | -- | |
| Brown Michael A | $24,000 | -- |
Source: Public Records
Mortgage History
| Date | Status | Borrower | Loan Amount |
|---|---|---|---|
| Previous Owner | Cobian Jose | $50,000 | |
| Closed | Gray Alan J | $0 |
Source: Public Records
Tax History Compared to Growth
Tax History
| Year | Tax Paid | Tax Assessment Tax Assessment Total Assessment is a certain percentage of the fair market value that is determined by local assessors to be the total taxable value of land and additions on the property. | Land | Improvement |
|---|---|---|---|---|
| 2024 | $2,630 | $63,660 | $14,140 | $49,520 |
| 2023 | $2,630 | $63,660 | $14,140 | $49,520 |
| 2022 | $1,950 | $43,430 | $10,690 | $32,740 |
| 2021 | $1,949 | $43,430 | $10,690 | $32,740 |
| 2020 | $1,969 | $43,430 | $10,690 | $32,740 |
| 2019 | $1,847 | $36,790 | $9,050 | $27,740 |
| 2018 | $1,829 | $36,790 | $9,050 | $27,740 |
| 2017 | $1,793 | $36,790 | $9,050 | $27,740 |
| 2016 | $1,867 | $37,400 | $8,780 | $28,620 |
| 2015 | $1,832 | $37,400 | $8,780 | $28,620 |
| 2014 | $1,825 | $37,400 | $8,780 | $28,620 |
| 2012 | $1,765 | $38,560 | $9,050 | $29,510 |
Source: Public Records
Map
Nearby Homes
- 531 Sequoia Ln
- 591 Straub Rd W
- 601 Karlson Dr
- 615 Bailey Dr
- 1011 Princeton Trace
- 1809 Sawmill Place Unit 1811
- 1928 Middle Bellville Rd
- 1689 Middle Bellville Rd
- 1702 Middle Bellville Rd
- 1790 Rippling Brook Dr
- 2055 Random Dr
- 0 Rippling Brook Dr
- 1720 Rippling Brook Dr
- 1915 Red Oak Dr
- 763 York St W
- 710 Cloverleaf Ct
- 1696 Riva Ridge Dr
- 1690 Riva Ridge Dr Unit 1690
- 646 Kennedy Dr
- 1840 Blue Cedar Dr
- 519 Straub Rd W Unit 521
- 519 Straub Rd W
- 517 Straub Rd W
- 515 Straub Rd W Unit 517
- 523 Straub Rd W
- 505 Broken Oak Ct
- 520 Sequoia Ln
- 506 Broken Oak Ct
- 503 Broken Oak Ct
- 531 Straub Rd W
- 0 Broken Oak Ct
- 315 Sequoia Ln
- 530 Sequoia Ln
- 509 Broken Oak Ct
- 508 Broken Oak Ct Unit 512
- 502 Broken Oak Ct
- 543 Straub Rd W
- 516 Broken Oak Ct
- 507 Broken Oak Ct Unit 509
- 514 Broken Oak Ct Unit 516