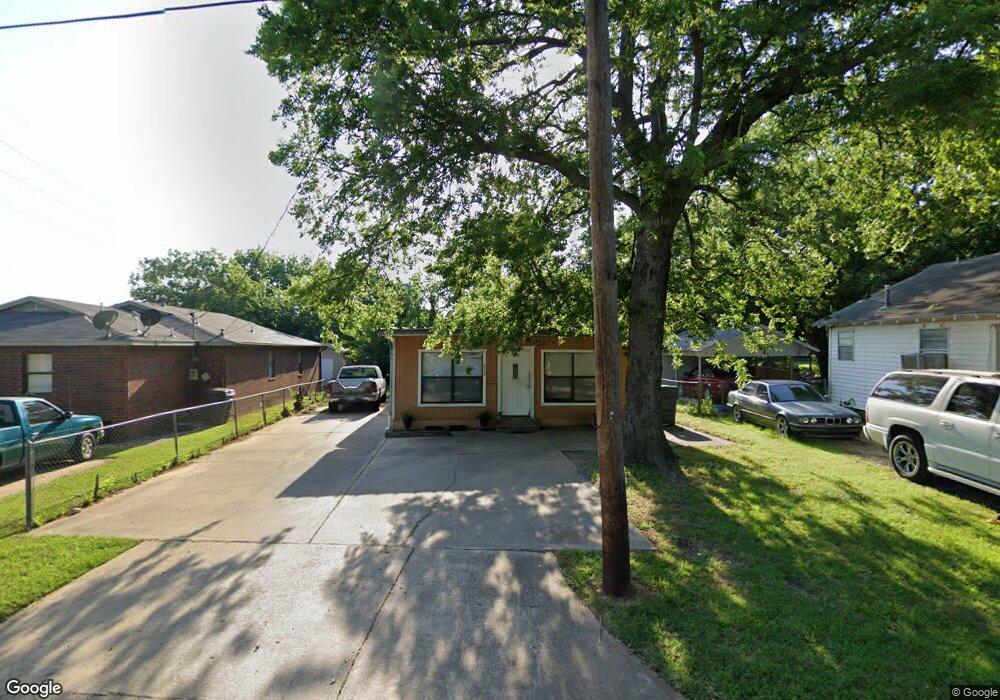
519 C St SW Ardmore, OK 73401
Estimated Value: $66,899 - $139,000
2
Beds
1
Bath
1,224
Sq Ft
$78/Sq Ft
Est. Value
About This Home
This home is located at 519 C St SW, Ardmore, OK 73401 and is currently estimated at $95,975, approximately $78 per square foot. 519 C St SW is a home located in Carter County with nearby schools including Lincoln Elementary School, Ardmore Middle School, and Ardmore High School.
Ownership History
Date
Name
Owned For
Owner Type
Purchase Details
Closed on
Nov 15, 2024
Sold by
1Bhp Holdings Llc
Bought by
Bhp Group Llc
Current Estimated Value
Home Financials for this Owner
Home Financials are based on the most recent Mortgage that was taken out on this home.
Original Mortgage
$388,900
Outstanding Balance
$385,172
Interest Rate
6.32%
Mortgage Type
New Conventional
Estimated Equity
-$289,197
Purchase Details
Closed on
May 7, 2019
Sold by
Gamboa Victor M and Gamboa Michele R
Bought by
Bhp Aircraft Leasing Llc
Purchase Details
Closed on
Oct 22, 1997
Sold by
Gamboa Victor M and Gamboa Mic
Bought by
Gamboa, Victor Etux Trust
Purchase Details
Closed on
Jun 25, 1997
Sold by
Freeman Richard M and Freeman T
Bought by
Gamboa Victor M and Gamboa Mic
Purchase Details
Closed on
Dec 21, 1995
Sold by
Shorter E L
Bought by
Freeman Richard M and Freeman T
Create a Home Valuation Report for This Property
The Home Valuation Report is an in-depth analysis detailing your home's value as well as a comparison with similar homes in the area
Home Values in the Area
Average Home Value in this Area
Purchase History
| Date | Buyer | Sale Price | Title Company |
|---|---|---|---|
| Bhp Group Llc | -- | Priority Title & Escrow | |
| Bhp Group Llc | -- | Priority Title & Escrow | |
| Bhp Group Llc | -- | Priority Title & Escrow | |
| Bhp Aircraft Leasing Llc | $45,000 | Stewart Title Oklahoma Inc | |
| Gamboa, Victor Etux Trust | -- | -- | |
| Gamboa Victor M | $27,000 | -- | |
| Freeman Richard M | $21,000 | -- |
Source: Public Records
Mortgage History
| Date | Status | Borrower | Loan Amount |
|---|---|---|---|
| Open | Bhp Group Llc | $388,900 | |
| Closed | Bhp Group Llc | $388,900 |
Source: Public Records
Tax History Compared to Growth
Tax History
| Year | Tax Paid | Tax Assessment Tax Assessment Total Assessment is a certain percentage of the fair market value that is determined by local assessors to be the total taxable value of land and additions on the property. | Land | Improvement |
|---|---|---|---|---|
| 2024 | $680 | $6,883 | $900 | $5,983 |
| 2023 | $647 | $6,555 | $900 | $5,655 |
| 2022 | $520 | $5,436 | $900 | $4,536 |
| 2021 | $522 | $5,177 | $900 | $4,277 |
| 2020 | $537 | $5,400 | $1,200 | $4,200 |
| 2019 | $615 | $6,337 | $1,200 | $5,137 |
| 2018 | $634 | $6,425 | $1,200 | $5,225 |
| 2017 | $572 | $6,259 | $1,108 | $5,151 |
| 2016 | $556 | $5,961 | $404 | $5,557 |
| 2015 | $436 | $5,677 | $200 | $5,477 |
| 2014 | $415 | $5,406 | $200 | $5,206 |
Source: Public Records
Map
Nearby Homes