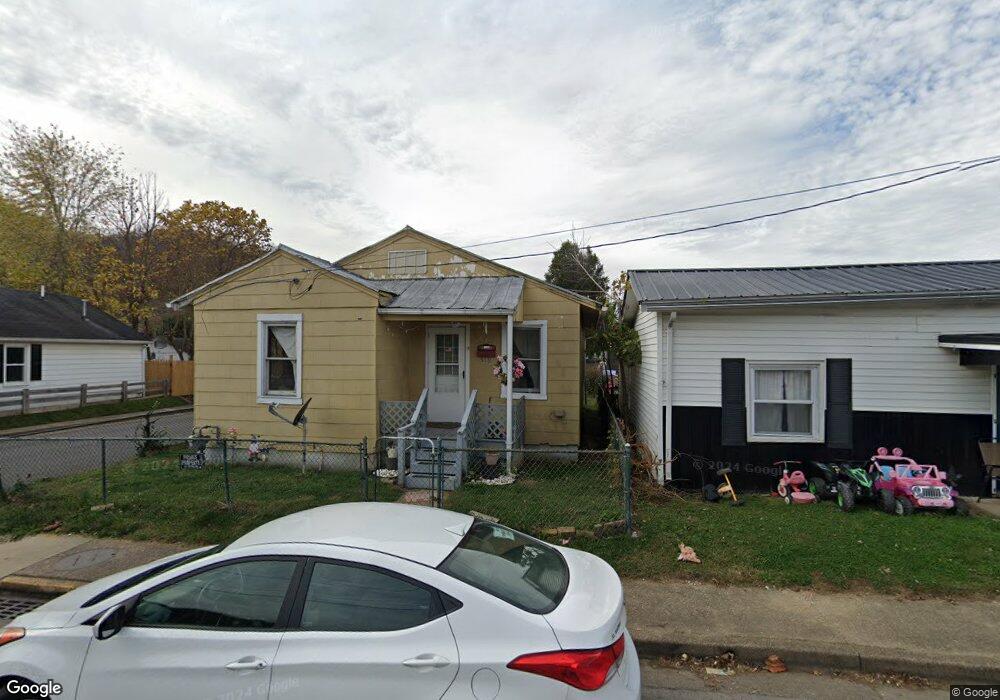
519 Clark St Maysville, KY 41056
Estimated Value: $51,000 - $100,000
3
Beds
1
Bath
924
Sq Ft
$78/Sq Ft
Est. Value
About This Home
This home is located at 519 Clark St, Maysville, KY 41056 and is currently estimated at $71,945, approximately $77 per square foot. 519 Clark St is a home located in Mason County with nearby schools including Charles Straub Elementary School, Mason County Intermediate School, and Mason County Middle School.
Ownership History
Date
Name
Owned For
Owner Type
Purchase Details
Closed on
Apr 19, 2024
Sold by
Lawrence Dev & Rental Props Ll
Bought by
Cornerstone Investment Llc
Current Estimated Value
Home Financials for this Owner
Home Financials are based on the most recent Mortgage that was taken out on this home.
Original Mortgage
$37,000
Outstanding Balance
$31,897
Interest Rate
0.62%
Mortgage Type
Construction
Estimated Equity
$40,048
Purchase Details
Closed on
Aug 1, 1994
Bought by
Mccann James D and Mccann Sue
Create a Home Valuation Report for This Property
The Home Valuation Report is an in-depth analysis detailing your home's value as well as a comparison with similar homes in the area
Home Values in the Area
Average Home Value in this Area
Purchase History
| Date | Buyer | Sale Price | Title Company |
|---|---|---|---|
| Cornerstone Investment Llc | $37,000 | Attorney Only | |
| Mccann James D | $15,000 | -- |
Source: Public Records
Mortgage History
| Date | Status | Borrower | Loan Amount |
|---|---|---|---|
| Open | Cornerstone Investment Llc | $37,000 |
Source: Public Records
Tax History Compared to Growth
Tax History
| Year | Tax Paid | Tax Assessment Tax Assessment Total Assessment is a certain percentage of the fair market value that is determined by local assessors to be the total taxable value of land and additions on the property. | Land | Improvement |
|---|---|---|---|---|
| 2024 | $97 | $37,000 | $5,000 | $32,000 |
| 2023 | $99 | $8,000 | $2,000 | $6,000 |
| 2022 | $98 | $8,000 | $2,000 | $6,000 |
| 2021 | $99 | $8,000 | $2,000 | $6,000 |
| 2020 | $186 | $15,000 | $5,000 | $10,000 |
| 2019 | $187 | $15,000 | $5,000 | $10,000 |
| 2018 | $186 | $15,000 | $5,000 | $10,000 |
| 2017 | $177 | $15,000 | $5,000 | $10,000 |
| 2016 | -- | $15,000 | $5,000 | $10,000 |
| 2015 | -- | $15,000 | $5,000 | $10,000 |
| 2012 | -- | $15,000 | $5,000 | $10,000 |
Source: Public Records
Map
Nearby Homes