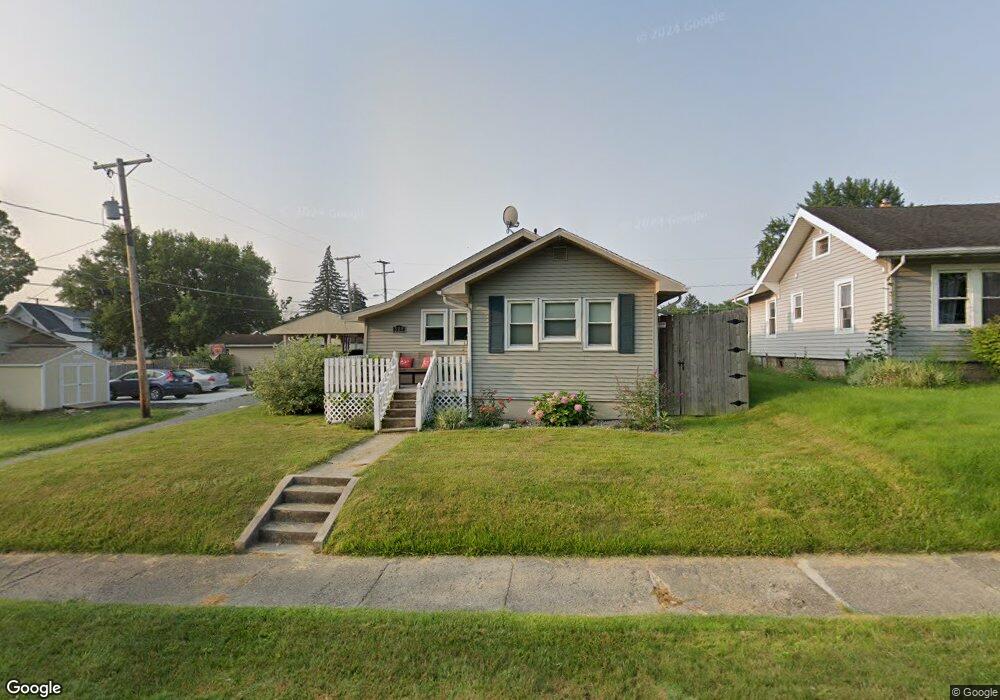
519 Clayton Ave Fort Wayne, IN 46808
Five Points NeighborhoodEstimated Value: $138,000 - $164,198
2
Beds
1
Bath
1,324
Sq Ft
$116/Sq Ft
Est. Value
About This Home
This home is located at 519 Clayton Ave, Fort Wayne, IN 46808 and is currently estimated at $153,550, approximately $115 per square foot. 519 Clayton Ave is a home located in Allen County with nearby schools including Franke Park Elementary School, Northwood Middle School, and North Side High School.
Ownership History
Date
Name
Owned For
Owner Type
Purchase Details
Closed on
Sep 21, 2011
Sold by
Dkr Mortgage Asset Trust I
Bought by
Salmons Anthony and Salmons Tamera K
Current Estimated Value
Home Financials for this Owner
Home Financials are based on the most recent Mortgage that was taken out on this home.
Original Mortgage
$19,920
Outstanding Balance
$1,765
Interest Rate
4.32%
Mortgage Type
New Conventional
Estimated Equity
$151,785
Purchase Details
Closed on
Jul 19, 2011
Sold by
Ruiz Quintana David
Bought by
Dkr Mortgage Asset Trust I
Purchase Details
Closed on
Aug 26, 2005
Sold by
Mangan Meghan E
Bought by
Quintana David Ruiz
Home Financials for this Owner
Home Financials are based on the most recent Mortgage that was taken out on this home.
Original Mortgage
$65,188
Interest Rate
5.89%
Mortgage Type
FHA
Purchase Details
Closed on
Jul 20, 2001
Sold by
Becraft Nolan J and Becraft Pansy L
Bought by
Mangan Meghan E
Home Financials for this Owner
Home Financials are based on the most recent Mortgage that was taken out on this home.
Original Mortgage
$58,580
Interest Rate
7.22%
Mortgage Type
FHA
Create a Home Valuation Report for This Property
The Home Valuation Report is an in-depth analysis detailing your home's value as well as a comparison with similar homes in the area
Home Values in the Area
Average Home Value in this Area
Purchase History
| Date | Buyer | Sale Price | Title Company |
|---|---|---|---|
| Salmons Anthony | -- | Titan Title Services Llc | |
| Dkr Mortgage Asset Trust I | $18,665 | None Available | |
| Quintana David Ruiz | -- | Metropolitan Title In Llc | |
| Mangan Meghan E | -- | -- |
Source: Public Records
Mortgage History
| Date | Status | Borrower | Loan Amount |
|---|---|---|---|
| Open | Salmons Anthony | $19,920 | |
| Previous Owner | Quintana David Ruiz | $65,188 | |
| Previous Owner | Mangan Meghan E | $58,580 |
Source: Public Records
Tax History Compared to Growth
Tax History
| Year | Tax Paid | Tax Assessment Tax Assessment Total Assessment is a certain percentage of the fair market value that is determined by local assessors to be the total taxable value of land and additions on the property. | Land | Improvement |
|---|---|---|---|---|
| 2024 | $1,154 | $146,400 | $18,400 | $128,000 |
| 2023 | $1,154 | $124,400 | $18,400 | $106,000 |
| 2022 | $945 | $104,600 | $18,400 | $86,200 |
| 2021 | $766 | $91,200 | $10,400 | $80,800 |
| 2020 | $632 | $83,000 | $10,400 | $72,600 |
| 2019 | $524 | $75,300 | $10,400 | $64,900 |
| 2018 | $486 | $68,900 | $10,400 | $58,500 |
| 2017 | $393 | $55,400 | $10,400 | $45,000 |
| 2016 | $394 | $55,100 | $10,400 | $44,700 |
| 2014 | $337 | $49,700 | $11,900 | $37,800 |
| 2013 | $337 | $50,200 | $11,900 | $38,300 |
Source: Public Records
Map
Nearby Homes
- 524 Clayton Ave
- 657 Florence Ave
- 2502 Sherman Blvd
- 808 Florence Ave
- 638 Greenlawn Ave
- 0 Sherman Blvd
- 1918 Short St
- 2115 Andrew St
- 618 Archer Ave
- 423 Mildred Ave
- 714 Archer Ave
- 2302 Eastbrook Dr
- 811 Mildred Ave
- 2431 Saint Marys Ave
- 2316 Oakridge Rd
- 712 Putnam St
- 1731 Andrew St
- 2927 Westbrook Dr Unit B212
- 2927 Westbrook Dr Unit B201
- 708 Huffman St
- 523 Clayton Ave
- 527 Clayton Ave
- 2325 Cortland Ave
- 2321 Cortland Ave
- 2329 Cortland Ave
- 533 Clayton Ave
- 2317 Cortland Ave
- 604 W State Blvd
- 602 W State Blvd
- 608 W State Blvd
- 535 Clayton Ave
- 2403 Cortland Ave
- 516 W State Blvd
- 612 W State Blvd
- 520 Clayton Ave
- 512 W State Blvd
- 616 W State Blvd
- 541 Clayton Ave
- 2407 Cortland Ave
- 504 W State Blvd