519 Crisp St Macon, GA 31206
Estimated Value: $35,580 - $75,000
2
Beds
1
Bath
960
Sq Ft
$52/Sq Ft
Est. Value
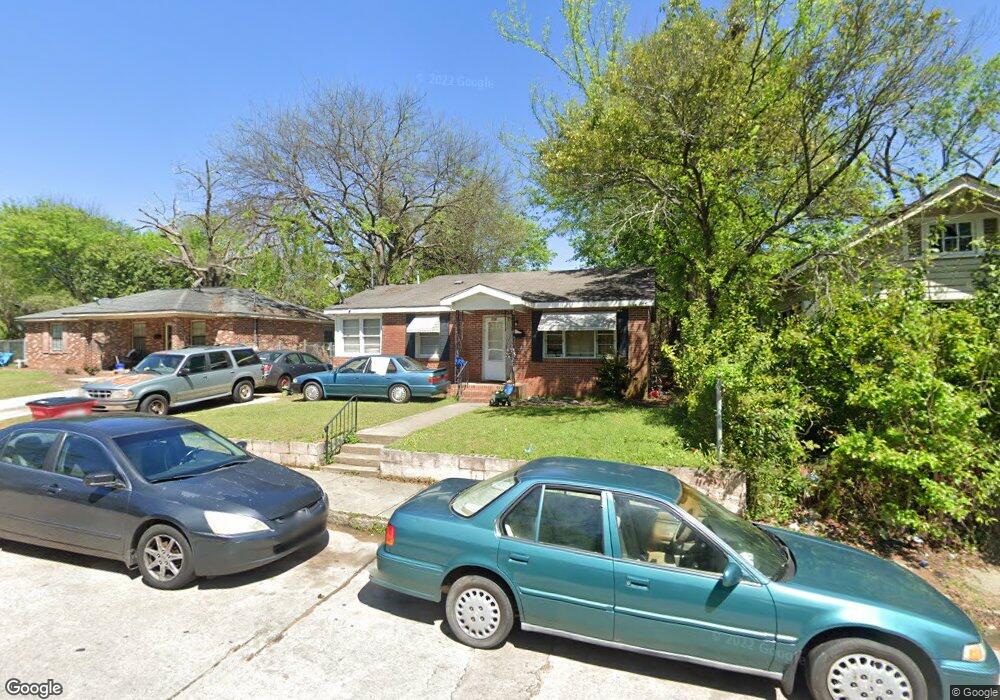
About This Home
This home is located at 519 Crisp St, Macon, GA 31206 and is currently estimated at $49,645, approximately $51 per square foot. 519 Crisp St is a home located in Bibb County with nearby schools including Ingram-Pye Elementary School, Central High School, and Cirrus Charter Academy.
Ownership History
Date
Name
Owned For
Owner Type
Purchase Details
Closed on
Apr 2, 2024
Sold by
Generational Family Inv Llc
Bought by
Progeny Homes Llc
Current Estimated Value
Purchase Details
Closed on
Feb 28, 2019
Sold by
Generational Family Investment Llc
Bought by
Hursey Willam H
Purchase Details
Closed on
Feb 26, 2019
Sold by
Mcmichael Robert L
Bought by
Hursey William H
Purchase Details
Closed on
Dec 21, 2005
Sold by
Webb Delores
Bought by
Mcmichael Robert L
Purchase Details
Closed on
Jan 4, 2005
Bought by
519 Crisp Trust
Home Financials for this Owner
Home Financials are based on the most recent Mortgage that was taken out on this home.
Original Mortgage
$227,060
Interest Rate
5.63%
Mortgage Type
Future Advance Clause Open End Mortgage
Create a Home Valuation Report for This Property
The Home Valuation Report is an in-depth analysis detailing your home's value as well as a comparison with similar homes in the area
Purchase History
| Date | Buyer | Sale Price | Title Company |
|---|---|---|---|
| Progeny Homes Llc | $30,000 | None Listed On Document | |
| Hursey Willam H | $8,000 | None Available | |
| Generational Family Investments Llc | $18,000 | None Available | |
| Hursey William H | -- | None Available | |
| Mcmichael Robert L | $32,500 | None Available | |
| 519 Crisp Trust | $28,100 | -- | |
| Webb Delores | $28,125 | None Avilabel |
Source: Public Records
Mortgage History
| Date | Status | Borrower | Loan Amount |
|---|---|---|---|
| Previous Owner | Webb Delores | $227,060 | |
| Previous Owner | 519 Crisp Trust | $227,600 |
Source: Public Records
Tax History
| Year | Tax Paid | Tax Assessment Tax Assessment Total Assessment is a certain percentage of the fair market value that is determined by local assessors to be the total taxable value of land and additions on the property. | Land | Improvement |
|---|---|---|---|---|
| 2025 | $482 | $19,611 | $1,560 | $18,051 |
| 2024 | $498 | $19,611 | $1,560 | $18,051 |
| 2023 | $495 | $16,696 | $1,040 | $15,656 |
| 2022 | $398 | $11,497 | $1,599 | $9,898 |
| 2021 | $298 | $7,841 | $771 | $7,070 |
| 2020 | $304 | $7,841 | $771 | $7,070 |
| 2019 | $280 | $7,153 | $726 | $6,427 |
| 2018 | $609 | $7,153 | $726 | $6,427 |
| 2017 | $268 | $7,153 | $726 | $6,427 |
| 2016 | $247 | $7,153 | $726 | $6,427 |
| 2015 | $413 | $8,438 | $726 | $7,713 |
| 2014 | $475 | $8,438 | $726 | $7,713 |
Source: Public Records
Map
Nearby Homes
- 548 Colquitt St
- 532 Nelson St
- 2752 Antioch Rd
- 579 Charles St
- 534 Hanson St
- 2872 Antioch Rd
- 678 Dixie Ave
- 2890 Bacon St
- 358 Pittman St
- 537 Rutherford Ave
- 648 Hightower Rd
- 579 Rutherford Ave
- 622 Cleveland St
- 2920 Houston Ave
- 2426 2nd St
- 645 Ell St
- 2476 Felton Ave
- 3402 Antioch Rd
- 780 Ponce de Leon Ave
- 672 Bowden St
Your Personal Tour Guide
Ask me questions while you tour the home.