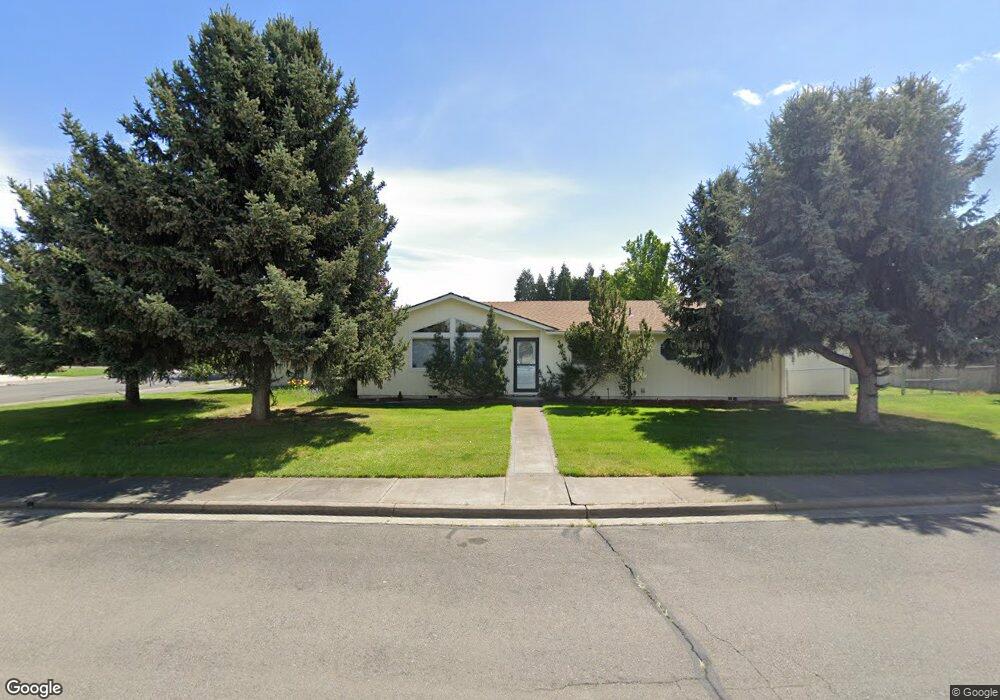
519 Daniel St Central Point, OR 97502
Estimated Value: $356,013 - $374,000
3
Beds
2
Baths
1,270
Sq Ft
$288/Sq Ft
Est. Value
About This Home
This home is located at 519 Daniel St, Central Point, OR 97502 and is currently estimated at $365,253, approximately $287 per square foot. 519 Daniel St is a home located in Jackson County with nearby schools including Richardson Elementary School, Scenic Middle School, and Crater High School.
Ownership History
Date
Name
Owned For
Owner Type
Purchase Details
Closed on
Mar 19, 2001
Sold by
Dunlap David M
Bought by
Dunlap David M and Dunlap Cindy L
Current Estimated Value
Purchase Details
Closed on
Jan 28, 1998
Sold by
Lyon Sharon J
Bought by
Dunlap David M
Home Financials for this Owner
Home Financials are based on the most recent Mortgage that was taken out on this home.
Original Mortgage
$103,550
Outstanding Balance
$16,055
Interest Rate
7.05%
Estimated Equity
$349,198
Create a Home Valuation Report for This Property
The Home Valuation Report is an in-depth analysis detailing your home's value as well as a comparison with similar homes in the area
Purchase History
| Date | Buyer | Sale Price | Title Company |
|---|---|---|---|
| Dunlap David M | -- | Jackson County Title | |
| Dunlap David M | $109,000 | Crater Title Insurance |
Source: Public Records
Mortgage History
| Date | Status | Borrower | Loan Amount |
|---|---|---|---|
| Open | Dunlap David M | $103,550 |
Source: Public Records
Tax History
| Year | Tax Paid | Tax Assessment Tax Assessment Total Assessment is a certain percentage of the fair market value that is determined by local assessors to be the total taxable value of land and additions on the property. | Land | Improvement |
|---|---|---|---|---|
| 2026 | $3,426 | $207,010 | -- | -- |
| 2025 | $3,342 | $200,990 | $62,830 | $138,160 |
| 2024 | $3,342 | $195,140 | $61,000 | $134,140 |
| 2023 | $3,234 | $189,460 | $59,220 | $130,240 |
| 2022 | $3,159 | $189,460 | $59,220 | $130,240 |
| 2021 | $3,069 | $183,950 | $57,500 | $126,450 |
| 2020 | $2,979 | $178,600 | $55,820 | $122,780 |
| 2019 | $2,906 | $168,350 | $52,620 | $115,730 |
| 2018 | $2,817 | $163,450 | $51,090 | $112,360 |
| 2017 | $2,746 | $163,450 | $51,090 | $112,360 |
| 2016 | $2,666 | $154,070 | $48,170 | $105,900 |
| 2015 | $2,554 | $154,070 | $48,170 | $105,900 |
| 2014 | $2,385 | $145,240 | $45,400 | $99,840 |
Source: Public Records
Map
Nearby Homes
- 436 Cheney Loop
- 1189 Lindsey Ct
- 871 Holley Way
- 185 Logan Ave
- 895 Holley Way
- 209 Corcoran Ln
- 349 W Pine St
- 114 Cedar St
- 827 Isherwood Dr
- 166 Nadine Ln
- 887 Silver Fox Dr
- 220 S 3rd St
- 755 S 4th St
- 350 Alder St
- 884 Mendolia Way
- 3288 Grant Rd
- 555 Freeman Rd Unit 73
- 555 Freeman Rd Unit 254
- 555 Freeman Rd Unit 105
- 555 Freeman Rd Unit 209
Your Personal Tour Guide
Ask me questions while you tour the home.