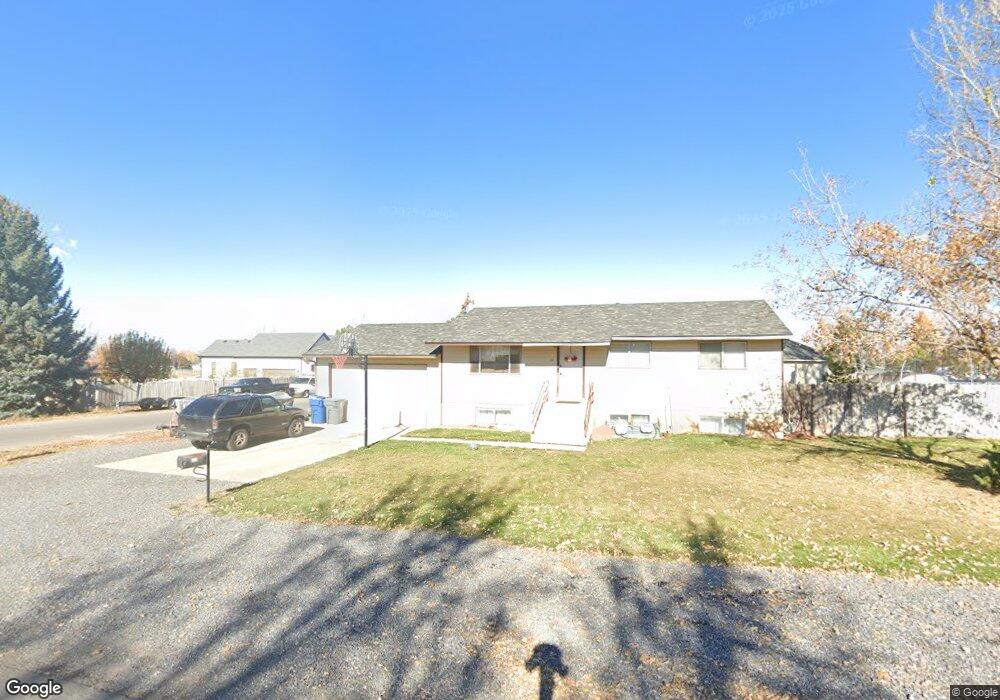
519 E 300 S Santaquin, UT 84655
Estimated Value: $441,000 - $464,000
5
Beds
2
Baths
2,160
Sq Ft
$210/Sq Ft
Est. Value
About This Home
This home is located at 519 E 300 S, Santaquin, UT 84655 and is currently estimated at $454,568, approximately $210 per square foot. 519 E 300 S is a home located in Utah County with nearby schools including Orchard Hills Elementary School, Payson Junior High School, and Mt. Nebo Middle.
Ownership History
Date
Name
Owned For
Owner Type
Purchase Details
Closed on
Apr 1, 2010
Sold by
Black Kerby L and Black Kristi L
Bought by
Black Kerby Lynn and Black Kristi
Current Estimated Value
Purchase Details
Closed on
Apr 2, 2003
Sold by
Stanley James and Stanley Karlene
Bought by
Black Kerby L and Black Kristi L
Home Financials for this Owner
Home Financials are based on the most recent Mortgage that was taken out on this home.
Original Mortgage
$127,281
Outstanding Balance
$54,800
Interest Rate
5.78%
Estimated Equity
$399,768
Purchase Details
Closed on
Sep 10, 2001
Sold by
Peterson Alden J
Bought by
Stanley James
Create a Home Valuation Report for This Property
The Home Valuation Report is an in-depth analysis detailing your home's value as well as a comparison with similar homes in the area
Home Values in the Area
Average Home Value in this Area
Purchase History
| Date | Buyer | Sale Price | Title Company |
|---|---|---|---|
| Black Kerby Lynn | -- | Richland Title Insurance Ag | |
| Black Kerby L | -- | First American Title Co | |
| Stanley James | -- | -- |
Source: Public Records
Mortgage History
| Date | Status | Borrower | Loan Amount |
|---|---|---|---|
| Open | Black Kerby L | $127,281 |
Source: Public Records
Tax History
| Year | Tax Paid | Tax Assessment Tax Assessment Total Assessment is a certain percentage of the fair market value that is determined by local assessors to be the total taxable value of land and additions on the property. | Land | Improvement |
|---|---|---|---|---|
| 2025 | $2,069 | $231,660 | -- | -- |
| 2024 | $2,069 | $206,030 | $0 | $0 |
| 2023 | $2,126 | $212,410 | $0 | $0 |
| 2022 | $2,062 | $212,465 | $0 | $0 |
| 2021 | $1,756 | $280,500 | $75,600 | $204,900 |
| 2020 | $1,679 | $259,900 | $65,700 | $194,200 |
| 2019 | $1,499 | $237,200 | $62,100 | $175,100 |
| 2018 | $1,396 | $210,700 | $58,400 | $152,300 |
| 2017 | $1,312 | $105,820 | $0 | $0 |
| 2016 | $1,192 | $94,215 | $0 | $0 |
| 2015 | $1,088 | $84,315 | $0 | $0 |
| 2014 | $981 | $75,900 | $0 | $0 |
Source: Public Records
Map
Nearby Homes
Your Personal Tour Guide
Ask me questions while you tour the home.