Estimated Value: $380,000 - $396,000
4
Beds
2
Baths
1,888
Sq Ft
$206/Sq Ft
Est. Value
About This Home
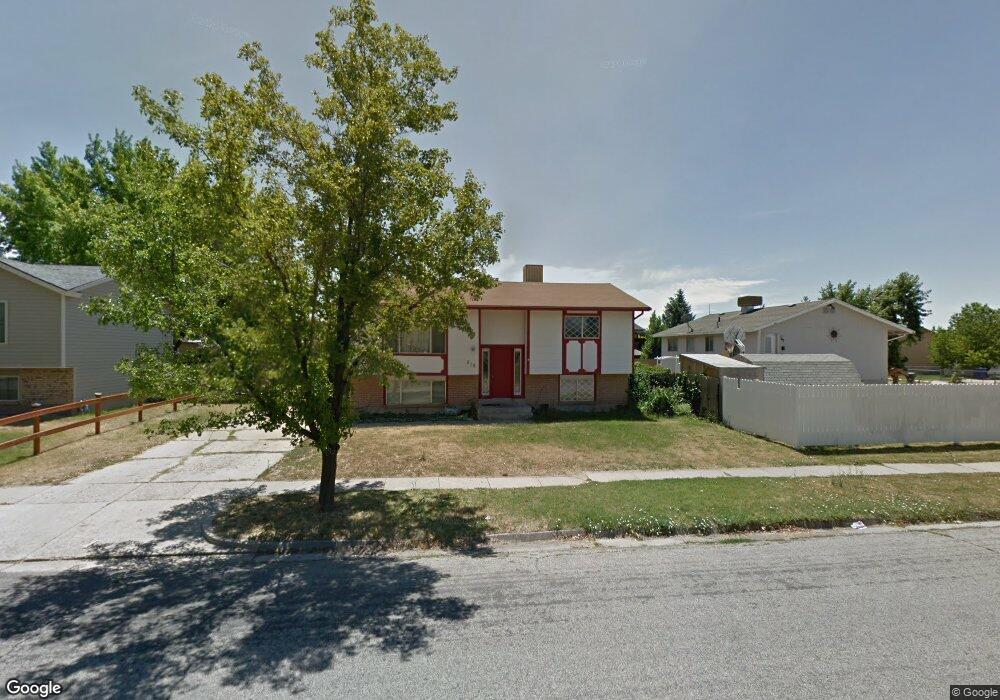
This home is located at 519 E 800 N, Ogden, UT 84404 and is currently estimated at $389,438, approximately $206 per square foot. 519 E 800 N is a home located in Weber County with nearby schools including Highland Junior High School, Ben Lomond High School, and Greenwood Charter School.
Ownership History
Date
Name
Owned For
Owner Type
Purchase Details
Closed on
Jun 13, 2023
Sold by
Dandoy Jamie
Bought by
Dandoy Jamie
Current Estimated Value
Home Financials for this Owner
Home Financials are based on the most recent Mortgage that was taken out on this home.
Original Mortgage
$299,348
Outstanding Balance
$291,343
Interest Rate
6.39%
Mortgage Type
FHA
Estimated Equity
$98,095
Purchase Details
Closed on
Jan 12, 2017
Sold by
Sine Lisa K
Bought by
Hill James J
Home Financials for this Owner
Home Financials are based on the most recent Mortgage that was taken out on this home.
Original Mortgage
$161,324
Interest Rate
3.95%
Mortgage Type
FHA
Purchase Details
Closed on
Jul 21, 1997
Sold by
Haarala David P
Bought by
Sine Lisa K
Home Financials for this Owner
Home Financials are based on the most recent Mortgage that was taken out on this home.
Original Mortgage
$91,624
Interest Rate
7.7%
Mortgage Type
FHA
Create a Home Valuation Report for This Property
The Home Valuation Report is an in-depth analysis detailing your home's value as well as a comparison with similar homes in the area
Home Values in the Area
Average Home Value in this Area
Purchase History
| Date | Buyer | Sale Price | Title Company |
|---|---|---|---|
| Dandoy Jamie | -- | First American Title | |
| Hill James J | -- | Security Title | |
| Sine Lisa K | -- | -- |
Source: Public Records
Mortgage History
| Date | Status | Borrower | Loan Amount |
|---|---|---|---|
| Open | Dandoy Jamie | $299,348 | |
| Previous Owner | Hill James J | $161,324 | |
| Previous Owner | Sine Lisa K | $91,624 |
Source: Public Records
Tax History
| Year | Tax Paid | Tax Assessment Tax Assessment Total Assessment is a certain percentage of the fair market value that is determined by local assessors to be the total taxable value of land and additions on the property. | Land | Improvement |
|---|---|---|---|---|
| 2025 | $2,486 | $364,435 | $115,010 | $249,425 |
| 2024 | $2,473 | $195,799 | $63,255 | $132,544 |
| 2023 | $2,443 | $194,700 | $60,424 | $134,276 |
| 2022 | $2,630 | $210,100 | $49,506 | $160,594 |
| 2021 | $1,968 | $261,000 | $55,000 | $206,000 |
| 2020 | $1,812 | $222,000 | $45,021 | $176,979 |
| 2019 | $1,696 | $195,000 | $40,093 | $154,907 |
| 2018 | $1,566 | $179,000 | $34,939 | $144,061 |
| 2017 | $1,396 | $149,000 | $34,939 | $114,061 |
| 2016 | $1,234 | $71,225 | $16,095 | $55,130 |
| 2015 | $1,012 | $56,983 | $16,095 | $40,888 |
| 2014 | $1,034 | $57,173 | $16,095 | $41,078 |
Source: Public Records
Map
Nearby Homes
- 448 E 900 N Unit 6
- 511 E 950 N Unit 34
- 461 E 960 N
- 835 N Washington Blvd Unit 1,2
- 526 E 980 N Unit 62
- 976 N Jefferson Ave
- 1001 N 550 E Unit 98
- 1010 N 525 E Unit 90
- 1020 N 525 E Unit 91
- 1013 N 450 St E Unit 60
- 1031 N 525 E Unit 85
- 965 N Liberty Ave
- 826 E 760 N
- 824 E 760 N
- 278 E Larsen Ln
- 264 E 700 N
- 827 E 760 N
- 1116 N Jefferson Ave
- 355 N Liberty Cove Dr
- 370 N Liberty Cove Dr Unit 5
Your Personal Tour Guide
Ask me questions while you tour the home.