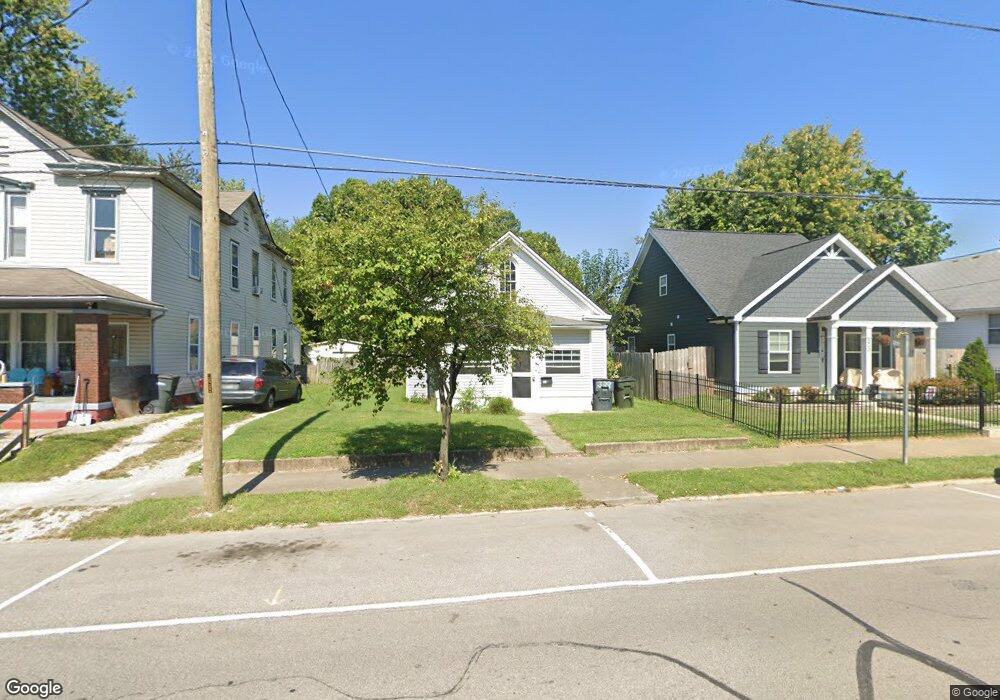
519 E Elm St New Albany, IN 47150
Estimated Value: $103,000 - $200,000
2
Beds
1
Bath
1,056
Sq Ft
$133/Sq Ft
Est. Value
About This Home
This home is located at 519 E Elm St, New Albany, IN 47150 and is currently estimated at $140,251, approximately $132 per square foot. 519 E Elm St is a home located in Floyd County with nearby schools including S. Ellen Jones Elementary School, Hazelwood Middle School, and New Albany Senior High School.
Ownership History
Date
Name
Owned For
Owner Type
Purchase Details
Closed on
Mar 9, 2023
Sold by
Dodson Matthew C
Bought by
Fitzline Ventures Llc
Current Estimated Value
Home Financials for this Owner
Home Financials are based on the most recent Mortgage that was taken out on this home.
Original Mortgage
$100,000
Outstanding Balance
$94,389
Interest Rate
6.13%
Mortgage Type
New Conventional
Estimated Equity
$45,862
Purchase Details
Closed on
Jul 11, 2022
Sold by
Freedom Equity Holdings 3 Llc
Bought by
Dodson Matthew C
Purchase Details
Closed on
Dec 17, 2021
Sold by
Sipes W L
Bought by
Freedom Equity Holdings 3 Llc
Purchase Details
Closed on
Apr 7, 2015
Sold by
519 E Elm Street Land Trust
Bought by
Sipes Trust
Purchase Details
Closed on
Mar 13, 2014
Sold by
Sipes W L
Bought by
519 E Elm Street Land Trust
Purchase Details
Closed on
Jan 3, 2014
Sold by
Floyd County Auditor
Bought by
Coddington Darin and Coddington Sipes W
Create a Home Valuation Report for This Property
The Home Valuation Report is an in-depth analysis detailing your home's value as well as a comparison with similar homes in the area
Home Values in the Area
Average Home Value in this Area
Purchase History
| Date | Buyer | Sale Price | Title Company |
|---|---|---|---|
| Fitzline Ventures Llc | -- | -- | |
| Dodson Matthew C | -- | None Listed On Document | |
| Freedom Equity Holdings 3 Llc | $120,000 | None Available | |
| Sipes Trust | -- | -- | |
| 519 E Elm Street Land Trust | -- | -- | |
| Coddington Darin | $2,505 | -- |
Source: Public Records
Mortgage History
| Date | Status | Borrower | Loan Amount |
|---|---|---|---|
| Open | Fitzline Ventures Llc | $100,000 |
Source: Public Records
Tax History
| Year | Tax Paid | Tax Assessment Tax Assessment Total Assessment is a certain percentage of the fair market value that is determined by local assessors to be the total taxable value of land and additions on the property. | Land | Improvement |
|---|---|---|---|---|
| 2024 | $3,008 | $82,200 | $8,900 | $73,300 |
| 2023 | $2,811 | $84,900 | $8,900 | $76,000 |
| 2022 | $1,853 | $50,900 | $8,900 | $42,000 |
| 2021 | $1,079 | $49,800 | $8,900 | $40,900 |
| 2020 | $1,060 | $48,900 | $8,900 | $40,000 |
| 2019 | $976 | $45,000 | $8,900 | $36,100 |
| 2018 | $968 | $44,400 | $8,900 | $35,500 |
| 2017 | $4,471 | $44,100 | $8,900 | $35,200 |
| 2016 | $1,570 | $43,700 | $8,900 | $34,800 |
| 2014 | $802 | $39,800 | $8,900 | $30,900 |
| 2013 | -- | $36,800 | $8,900 | $27,900 |
Source: Public Records
Map
Nearby Homes
- 620 E 9th St
- 922 E Spring St
- 1113 Culbertson Ave
- 1120 Ekin Ave
- 1118 E Spring St
- 1217 E Spring St
- 1110 Chartres St
- 1313 Culbertson Ave
- 1120 Chartres St
- 325 E 14th St
- 335 E 15th St
- 1406 Chartres St
- 155 Jackson St
- 1525 E Oak St
- 1521 Ekin Ave
- 336 E 16th St
- 1108 State St
- 1428 Locust St
- 1611 King St
- 608 E Oak St
Your Personal Tour Guide
Ask me questions while you tour the home.