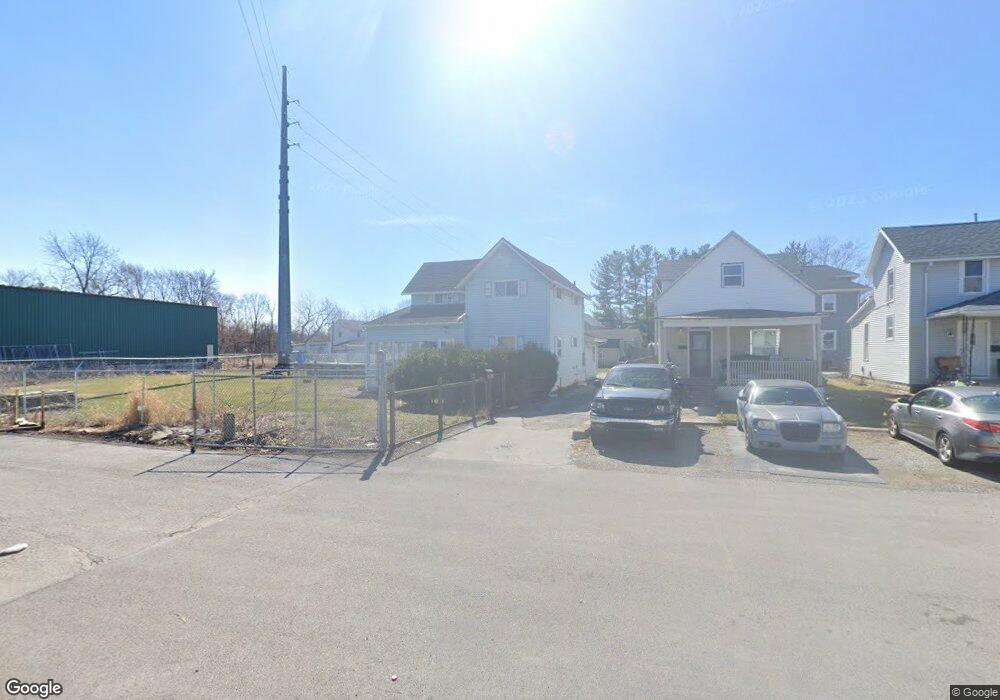
519 E Lima St Findlay, OH 45840
Estimated Value: $167,000 - $221,000
3
Beds
2
Baths
1,776
Sq Ft
$108/Sq Ft
Est. Value
About This Home
This home is located at 519 E Lima St, Findlay, OH 45840 and is currently estimated at $192,587, approximately $108 per square foot. 519 E Lima St is a home located in Hancock County with nearby schools including Lincoln Elementary School, Donnell Middle School, and Findlay High School.
Ownership History
Date
Name
Owned For
Owner Type
Purchase Details
Closed on
Jun 26, 2020
Sold by
Cramer Steve R
Bought by
Martinez Ramon and Martinez Sarah
Current Estimated Value
Home Financials for this Owner
Home Financials are based on the most recent Mortgage that was taken out on this home.
Original Mortgage
$91,315
Outstanding Balance
$81,122
Interest Rate
3.2%
Mortgage Type
FHA
Estimated Equity
$111,465
Purchase Details
Closed on
Dec 9, 2003
Sold by
Kolan Peter G and Kolan Karyn
Bought by
Cramer Steve R
Create a Home Valuation Report for This Property
The Home Valuation Report is an in-depth analysis detailing your home's value as well as a comparison with similar homes in the area
Home Values in the Area
Average Home Value in this Area
Purchase History
| Date | Buyer | Sale Price | Title Company |
|---|---|---|---|
| Martinez Ramon | $93,000 | None Available | |
| Cramer Steve R | $80,000 | Quality Title Agency Inc |
Source: Public Records
Mortgage History
| Date | Status | Borrower | Loan Amount |
|---|---|---|---|
| Open | Martinez Ramon | $91,315 |
Source: Public Records
Tax History Compared to Growth
Tax History
| Year | Tax Paid | Tax Assessment Tax Assessment Total Assessment is a certain percentage of the fair market value that is determined by local assessors to be the total taxable value of land and additions on the property. | Land | Improvement |
|---|---|---|---|---|
| 2024 | $1,853 | $52,160 | $9,880 | $42,280 |
| 2023 | $1,856 | $52,160 | $9,880 | $42,280 |
| 2022 | $1,849 | $52,160 | $9,880 | $42,280 |
| 2021 | $1,434 | $35,220 | $4,830 | $30,390 |
| 2020 | $1,433 | $35,220 | $4,830 | $30,390 |
| 2019 | $1,388 | $34,820 | $4,430 | $30,390 |
| 2018 | $1,330 | $30,550 | $3,850 | $26,700 |
| 2017 | $664 | $30,550 | $3,850 | $26,700 |
| 2016 | $1,317 | $30,550 | $3,850 | $26,700 |
| 2015 | $1,502 | $34,350 | $12,770 | $21,580 |
| 2014 | $1,502 | $34,350 | $12,770 | $21,580 |
| 2012 | $1,066 | $24,140 | $3,850 | $20,290 |
Source: Public Records
Map
Nearby Homes
- 829 Maple Ave
- 904 Morse St
- 900 Morse St
- 615 E Sandusky St
- 15591 Canadian Way
- 15586 Canadian Way
- 15615 Canadian Way
- 320 W Lima St
- 123 Glendale Ave
- 1109 Brookside Dr
- 514 Liberty St
- 412 Lima Ave
- 545 Clinton Ct
- 416 1/2 Lima Ave
- 1113 Hurd Ave
- 523 Center St
- 1304 Douglas Pkwy
- 1001 Decker Ave
- 1008 Eastview Dr
- 1037 Fishlock Ave