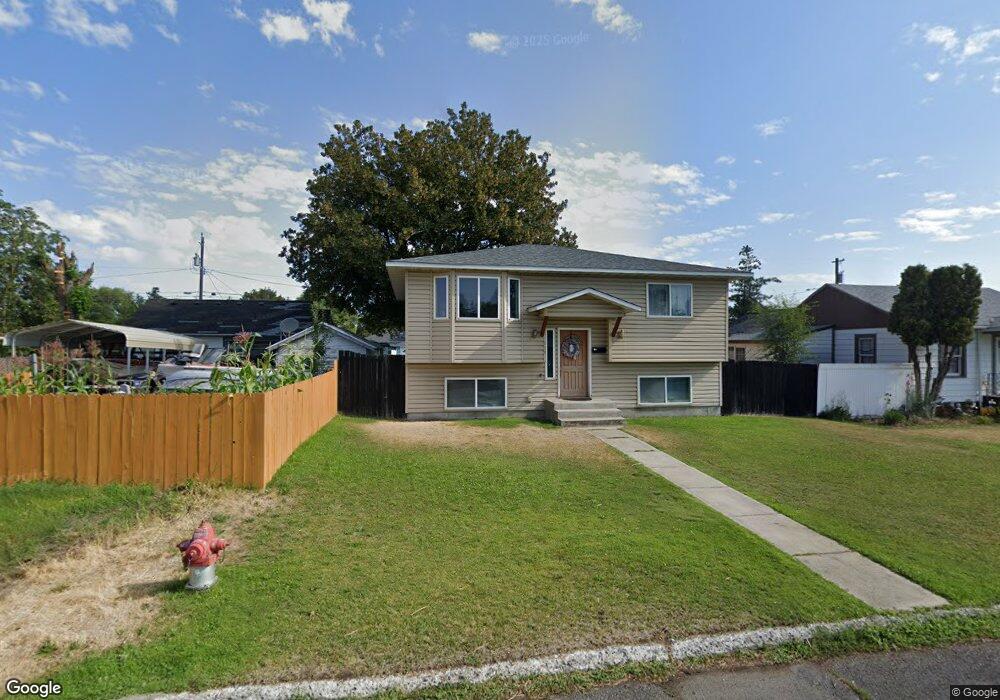
519 E North Ave Spokane, WA 99207
Greenacres NeighborhoodEstimated Value: $325,000 - $371,000
3
Beds
2
Baths
1,754
Sq Ft
$197/Sq Ft
Est. Value
About This Home
This home is located at 519 E North Ave, Spokane, WA 99207 and is currently estimated at $346,402, approximately $197 per square foot. 519 E North Ave is a home located in Spokane County with nearby schools including Greenacres Elementary School, Greenacres Middle School, and Central Valley High School.
Ownership History
Date
Name
Owned For
Owner Type
Purchase Details
Closed on
Jun 15, 2009
Sold by
Briggs Joel and Briggs Patricia
Bought by
Robinson Carolyn E
Current Estimated Value
Home Financials for this Owner
Home Financials are based on the most recent Mortgage that was taken out on this home.
Original Mortgage
$161,029
Outstanding Balance
$101,685
Interest Rate
4.76%
Mortgage Type
FHA
Estimated Equity
$244,717
Purchase Details
Closed on
Jul 25, 2006
Sold by
Distad Roger L and Distad Becky G
Bought by
Briggs Joel and Briggs Patricia S
Home Financials for this Owner
Home Financials are based on the most recent Mortgage that was taken out on this home.
Original Mortgage
$107,500
Interest Rate
7%
Mortgage Type
Purchase Money Mortgage
Purchase Details
Closed on
Mar 28, 2006
Sold by
Jay Richard A
Bought by
Distad Roger L and Distad Becky G
Purchase Details
Closed on
Sep 29, 1999
Sold by
Evans Ben M
Bought by
Jay Richard A
Create a Home Valuation Report for This Property
The Home Valuation Report is an in-depth analysis detailing your home's value as well as a comparison with similar homes in the area
Home Values in the Area
Average Home Value in this Area
Purchase History
| Date | Buyer | Sale Price | Title Company |
|---|---|---|---|
| Robinson Carolyn E | $164,000 | First American Title Ins Co | |
| Briggs Joel | $157,500 | First American Title Ins | |
| Distad Roger L | $30,000 | Transnation Title | |
| Jay Richard A | $56,500 | Transnation Title Insurance |
Source: Public Records
Mortgage History
| Date | Status | Borrower | Loan Amount |
|---|---|---|---|
| Open | Robinson Carolyn E | $161,029 | |
| Previous Owner | Briggs Joel | $107,500 |
Source: Public Records
Tax History
| Year | Tax Paid | Tax Assessment Tax Assessment Total Assessment is a certain percentage of the fair market value that is determined by local assessors to be the total taxable value of land and additions on the property. | Land | Improvement |
|---|---|---|---|---|
| 2025 | $3,155 | $311,200 | $68,000 | $243,200 |
| 2024 | $3,155 | $317,700 | $60,000 | $257,700 |
| 2023 | $3,049 | $311,500 | $55,000 | $256,500 |
| 2022 | $3,057 | $311,500 | $55,000 | $256,500 |
| 2021 | $2,296 | $192,700 | $30,000 | $162,700 |
| 2020 | $2,149 | $173,700 | $30,000 | $143,700 |
| 2019 | $1,903 | $159,000 | $22,000 | $137,000 |
| 2018 | $2,061 | $148,000 | $20,000 | $128,000 |
| 2017 | $1,982 | $144,900 | $20,000 | $124,900 |
| 2016 | $1,903 | $136,100 | $20,000 | $116,100 |
| 2015 | $1,953 | $136,700 | $27,500 | $109,200 |
| 2014 | -- | $136,800 | $27,500 | $109,300 |
| 2013 | -- | $0 | $0 | $0 |
Source: Public Records
Map
Nearby Homes
- 710 E North Ave
- 524 N Long Rd
- 17628 E Alki Ave
- 228 N Viewmont Ct
- 515 N Viewmont Ct
- 420 N Viewmont Ct
- 416 N Viewmont Ct
- 306 N Viewmont Ct
- 414 N Viewmont Ct
- 418 N Viewmont Ct
- 316 N Viewmont Ct
- 521 N Viewmont Ct
- 519 N Viewmont Ct
- 304 N Viewmont Ct
- 302 N Viewmont Ct
- 517 N Viewmont Ct
- 412 N Viewmont Ct Unit 1/2 Canyon
- 18511 E 3rd Ave
- 17616 E Alki Ave
- 312 N Viewmont Ct
- 519 N Greenacres Rd
- 511 N Greenacres Rd
- 527 N Greenacres Rd
- 506 N Greenacres Rd
- 528 N Greenacres Rd
- 530 N Greenacres Rd
- 421 N Greenacres Rd
- 18208 E Alki Ave
- 502 N Greenacres Rd
- 602 N Greenacres Rd
- 603 E North Ave
- 18314 E Alki Ave
- 603 N Greenacres Rd
- 18305 E Cowley Ave
- 18304 E Alki Ave
- 18211 E Alki Ave
- 18317 E Cowley Ave
- 18112 E Alki Ave
- 18306 E Alki Ave
- 18201 E Alki Ave
Your Personal Tour Guide
Ask me questions while you tour the home.