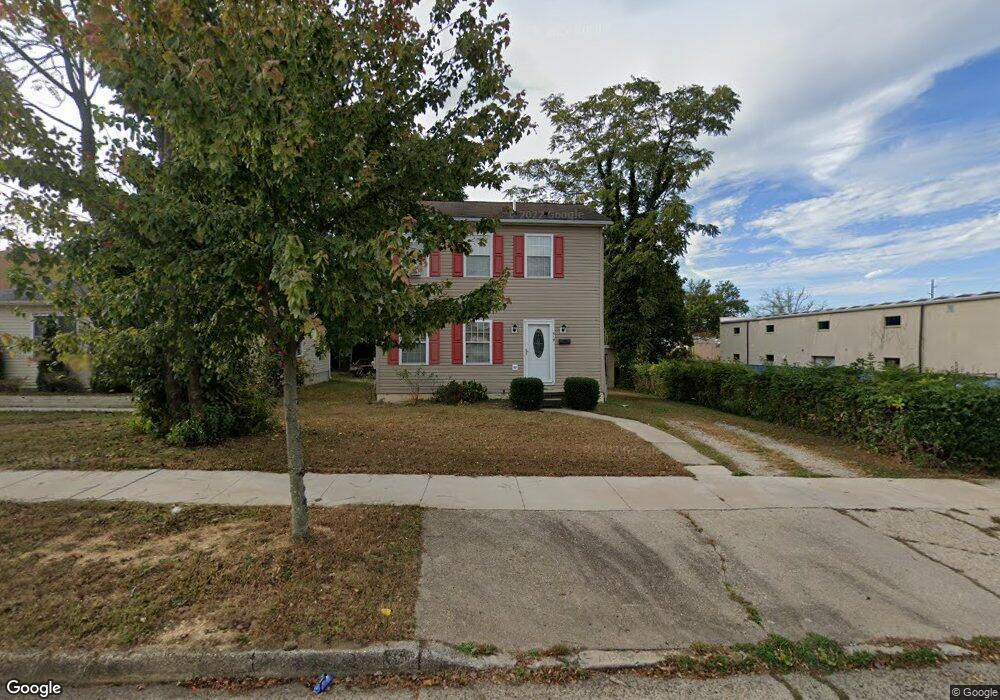
519 E Plum St Unit 521 Vineland, NJ 08360
Estimated Value: $222,000 - $261,000
Studio
--
Bath
1,250
Sq Ft
$196/Sq Ft
Est. Value
About This Home
This home is located at 519 E Plum St Unit 521, Vineland, NJ 08360 and is currently estimated at $245,056, approximately $196 per square foot. 519 E Plum St Unit 521 is a home located in Cumberland County with nearby schools including D'Ippolito Elementary School, Veterans Memorial Intermediate School, and Vineland Senior High School.
Ownership History
Date
Name
Owned For
Owner Type
Purchase Details
Closed on
Dec 17, 1997
Sold by
E & R Homes Inc
Bought by
Torres Alberto and Torres Aurea
Current Estimated Value
Home Financials for this Owner
Home Financials are based on the most recent Mortgage that was taken out on this home.
Original Mortgage
$69,000
Outstanding Balance
$11,581
Interest Rate
7.14%
Estimated Equity
$233,475
Create a Home Valuation Report for This Property
The Home Valuation Report is an in-depth analysis detailing your home's value as well as a comparison with similar homes in the area
Home Values in the Area
Average Home Value in this Area
Purchase History
| Date | Buyer | Sale Price | Title Company |
|---|---|---|---|
| Torres Alberto | $68,850 | -- |
Source: Public Records
Mortgage History
| Date | Status | Borrower | Loan Amount |
|---|---|---|---|
| Open | Torres Alberto | $69,000 |
Source: Public Records
Tax History
| Year | Tax Paid | Tax Assessment Tax Assessment Total Assessment is a certain percentage of the fair market value that is determined by local assessors to be the total taxable value of land and additions on the property. | Land | Improvement |
|---|---|---|---|---|
| 2025 | $4,311 | $135,400 | $16,400 | $119,000 |
| 2024 | $4,311 | $135,400 | $16,400 | $119,000 |
| 2023 | $4,283 | $135,400 | $16,400 | $119,000 |
| 2022 | $4,155 | $135,400 | $16,400 | $119,000 |
| 2021 | $3,806 | $135,400 | $16,400 | $119,000 |
| 2020 | $3,963 | $135,400 | $16,400 | $119,000 |
| 2019 | $3,909 | $135,400 | $16,400 | $119,000 |
| 2018 | $3,806 | $135,400 | $16,400 | $119,000 |
| 2017 | $3,615 | $135,400 | $16,400 | $119,000 |
| 2016 | $3,488 | $135,400 | $16,400 | $119,000 |
| 2015 | $3,359 | $135,400 | $16,400 | $119,000 |
| 2014 | $3,176 | $135,400 | $16,400 | $119,000 |
Source: Public Records
Map
Nearby Homes
- 520 E Grape St
- 511 E Grape St
- 330 W Peach St
- 220 S 7th St
- 329 W Grape St
- 812 E Elmer St
- 818 E Pear St
- 314 S 4th St
- 406 S 6th St
- 739 E Montrose St
- 404 Montrose St
- 411 N East Ave
- 48 N Myrtle St
- 306 S East Ave
- 118 W Park Ave
- 816 E Quince St
- 32 S Myrtle St
- 708 E Chestnut Ave
- 1009 Hamilton Dr
- 502 N West Ave
Your Personal Tour Guide
Ask me questions while you tour the home.