519 Hammers Rd Ardmore, OK 73401
Estimated Value: $124,000 - $155,000
3
Beds
1
Bath
1,392
Sq Ft
$104/Sq Ft
Est. Value
About This Home
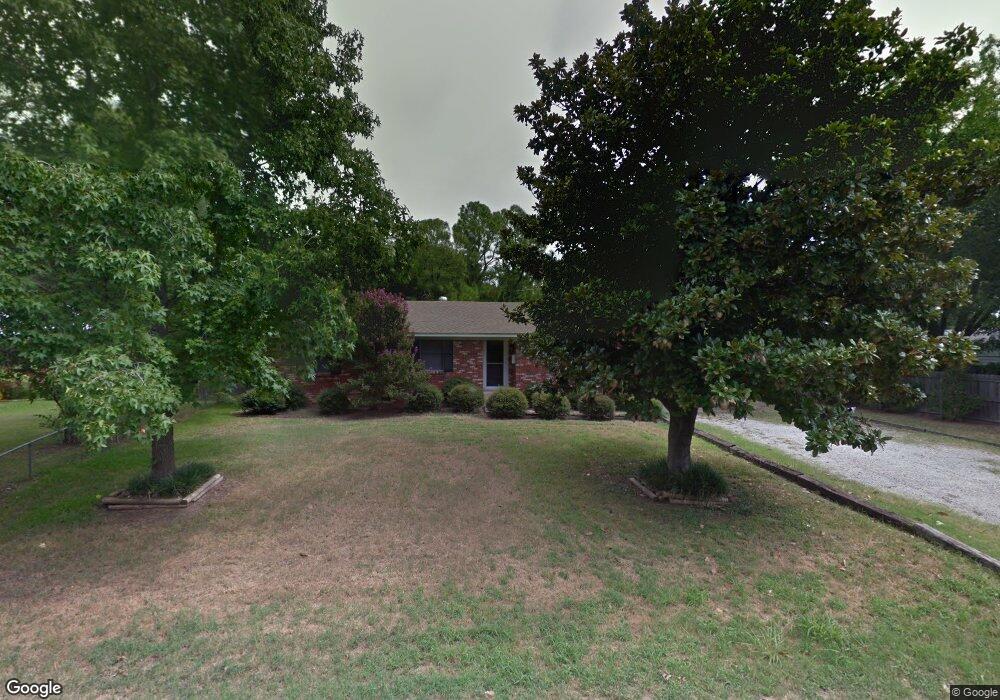
This home is located at 519 Hammers Rd, Ardmore, OK 73401 and is currently estimated at $144,279, approximately $103 per square foot. 519 Hammers Rd is a home located in Carter County with nearby schools including Lincoln Elementary School, Ardmore Middle School, and Ardmore High School.
Ownership History
Date
Name
Owned For
Owner Type
Purchase Details
Closed on
May 13, 2008
Sold by
Housley Floyd A
Bought by
Black Laura Leann
Current Estimated Value
Home Financials for this Owner
Home Financials are based on the most recent Mortgage that was taken out on this home.
Original Mortgage
$102,210
Outstanding Balance
$64,084
Interest Rate
5.86%
Mortgage Type
FHA
Estimated Equity
$80,195
Purchase Details
Closed on
May 26, 2006
Sold by
Housley Linda L
Bought by
Housley Floyd A
Purchase Details
Closed on
Sep 8, 2005
Sold by
Elmer Aaron M and Elmer Aaron Michael
Bought by
Housley Floyd A
Home Financials for this Owner
Home Financials are based on the most recent Mortgage that was taken out on this home.
Original Mortgage
$61,000
Interest Rate
5.78%
Mortgage Type
New Conventional
Purchase Details
Closed on
Jul 17, 2002
Sold by
Sullivan James K and Sullivan Beck
Bought by
Elmer Arron M and Elmer Rebecca
Purchase Details
Closed on
May 18, 2000
Sold by
Forrester Kaylan Jo Keit
Bought by
Sullivan James K and Sullivan Bec
Create a Home Valuation Report for This Property
The Home Valuation Report is an in-depth analysis detailing your home's value as well as a comparison with similar homes in the area
Purchase History
| Date | Buyer | Sale Price | Title Company |
|---|---|---|---|
| Black Laura Leann | $106,000 | -- | |
| Housley Floyd A | -- | -- | |
| Housley Floyd A | $91,000 | -- | |
| Elmer Arron M | $78,500 | -- | |
| Sullivan James K | $54,500 | -- |
Source: Public Records
Mortgage History
| Date | Status | Borrower | Loan Amount |
|---|---|---|---|
| Open | Black Laura Leann | $102,210 | |
| Previous Owner | Housley Floyd A | $61,000 |
Source: Public Records
Tax History
| Year | Tax Paid | Tax Assessment Tax Assessment Total Assessment is a certain percentage of the fair market value that is determined by local assessors to be the total taxable value of land and additions on the property. | Land | Improvement |
|---|---|---|---|---|
| 2025 | $1,409 | $14,124 | $1,800 | $12,324 |
| 2024 | $1,410 | $13,452 | $1,800 | $11,652 |
| 2023 | $1,343 | $12,811 | $1,800 | $11,011 |
| 2022 | $1,166 | $12,201 | $1,800 | $10,401 |
| 2021 | $1,172 | $11,620 | $1,800 | $9,820 |
| 2020 | $1,100 | $11,067 | $1,800 | $9,267 |
| 2019 | $1,075 | $11,069 | $1,800 | $9,269 |
| 2018 | $1,057 | $10,704 | $1,200 | $9,504 |
| 2017 | $938 | $10,255 | $1,125 | $9,130 |
| 2016 | $910 | $9,767 | $989 | $8,778 |
| 2015 | $715 | $9,301 | $893 | $8,408 |
| 2014 | $892 | $9,969 | $893 | $9,076 |
Source: Public Records
Map
Nearby Homes
- 532 Hammers Rd
- 1201 5th Ave SW
- 407 S Commerce St
- 321 Wheeler St SW
- 1203 SW 4th
- 311 Wheeler St SW
- 332 I St SW
- 711 N St SW
- 1301 3rd Ave SW
- 509 G St SW
- 1002 Stanley St SW
- 1317 3rd Ave SW
- 625 Frensley St SW
- 1418 3rd Ave SW
- 1103 Stanley St SW
- 1415 3rd Ave SW
- 1206 Bixby St
- 912 Culbertson St SW
- 518 Frisco Ln
- 1424 Stanley St SW
Your Personal Tour Guide
Ask me questions while you tour the home.