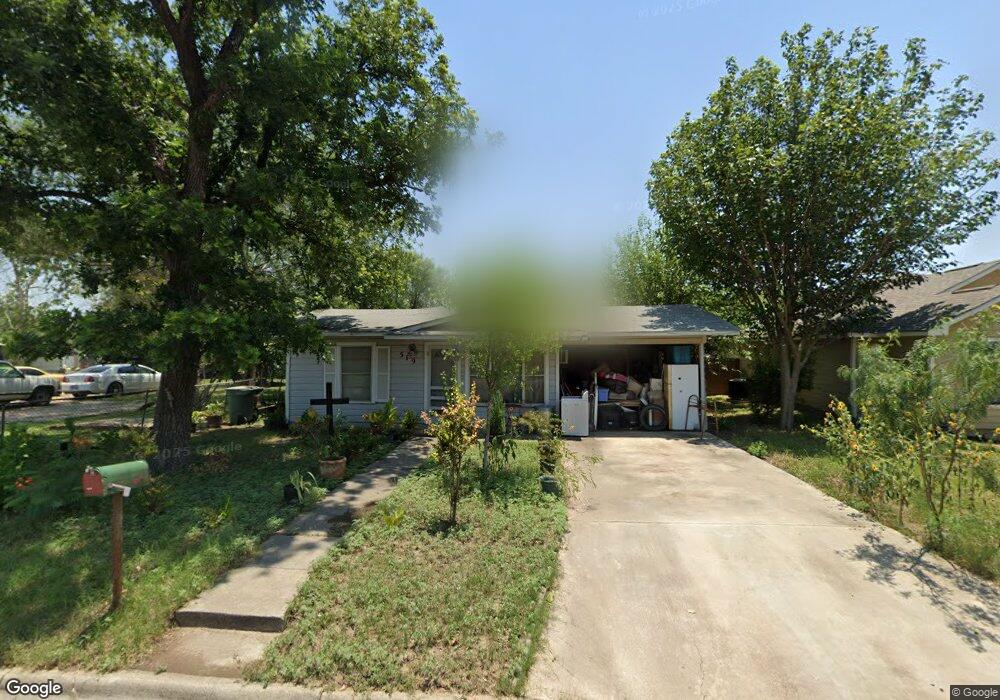
519 Juarez St Uvalde, TX 78801
Estimated Value: $89,611 - $144,000
--
Bed
--
Bath
816
Sq Ft
$150/Sq Ft
Est. Value
About This Home
This home is located at 519 Juarez St, Uvalde, TX 78801 and is currently estimated at $122,153, approximately $149 per square foot. 519 Juarez St is a home located in Uvalde County with nearby schools including Uvalde High School, Sacred Heart Parish School, and St. Philip's Episcopal School.
Ownership History
Date
Name
Owned For
Owner Type
Purchase Details
Closed on
May 19, 2015
Sold by
Santos Ricardo S
Bought by
Sotelo Rojelio F
Current Estimated Value
Home Financials for this Owner
Home Financials are based on the most recent Mortgage that was taken out on this home.
Original Mortgage
$35,000
Outstanding Balance
$26,934
Interest Rate
3.73%
Mortgage Type
Purchase Money Mortgage
Estimated Equity
$95,219
Create a Home Valuation Report for This Property
The Home Valuation Report is an in-depth analysis detailing your home's value as well as a comparison with similar homes in the area
Home Values in the Area
Average Home Value in this Area
Purchase History
| Date | Buyer | Sale Price | Title Company |
|---|---|---|---|
| Sotelo Rojelio F | -- | None Available |
Source: Public Records
Mortgage History
| Date | Status | Borrower | Loan Amount |
|---|---|---|---|
| Open | Sotelo Rojelio F | $35,000 |
Source: Public Records
Tax History Compared to Growth
Tax History
| Year | Tax Paid | Tax Assessment Tax Assessment Total Assessment is a certain percentage of the fair market value that is determined by local assessors to be the total taxable value of land and additions on the property. | Land | Improvement |
|---|---|---|---|---|
| 2025 | $699 | $62,634 | $18,000 | $58,476 |
| 2024 | $1,100 | $56,940 | $18,000 | $54,731 |
| 2023 | $654 | $51,764 | $13,600 | $41,739 |
| 2022 | $1,174 | $49,635 | $11,450 | $38,185 |
| 2021 | $1,169 | $42,780 | $9,500 | $33,280 |
| 2020 | $1,121 | $40,211 | $8,500 | $31,711 |
| 2019 | $1,134 | $39,835 | $8,500 | $31,335 |
| 2018 | $1,204 | $39,835 | $8,500 | $31,335 |
| 2017 | $1,143 | $38,335 | $7,000 | $31,335 |
| 2016 | $1,079 | $36,185 | $5,950 | $30,235 |
| 2015 | -- | $36,601 | $5,950 | $30,651 |
| 2014 | -- | $37,486 | $5,950 | $31,536 |
Source: Public Records
Map
Nearby Homes