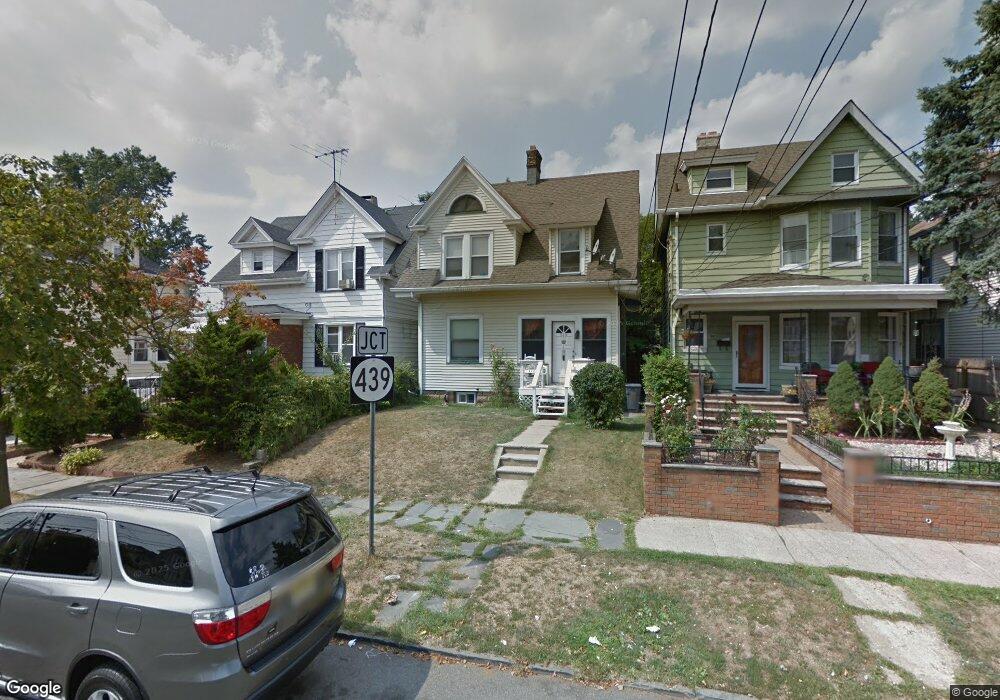
519 Linden Ave Unit 521 Elizabeth, NJ 07202
Elmora NeighborhoodEstimated Value: $503,000 - $574,000
3
Beds
1
Bath
1,460
Sq Ft
$368/Sq Ft
Est. Value
About This Home
This home is located at 519 Linden Ave Unit 521, Elizabeth, NJ 07202 and is currently estimated at $536,761, approximately $367 per square foot. 519 Linden Ave Unit 521 is a home located in Union County with nearby schools including Number 14, Abraham Lincoln Elementary School, Elizabeth High School, and Jewish Educational Center Lower School.
Ownership History
Date
Name
Owned For
Owner Type
Purchase Details
Closed on
May 18, 2018
Sold by
Mtglq Investors Lp
Bought by
Gurerrero Tania E and Arizaga Mishella
Current Estimated Value
Purchase Details
Closed on
Jan 17, 2018
Sold by
Murcia Virgillio and Murcia Virgillio E
Bought by
Mtglq Investor Lp
Purchase Details
Closed on
Nov 10, 2004
Sold by
Gajardo Sergio
Bought by
Murcia Mirna
Home Financials for this Owner
Home Financials are based on the most recent Mortgage that was taken out on this home.
Original Mortgage
$251,200
Interest Rate
5.8%
Purchase Details
Closed on
Jan 30, 2001
Sold by
Gloria Joao and Gloria Justina
Bought by
Gajardo Sergio L
Purchase Details
Closed on
Nov 3, 1995
Sold by
Fromm Lucille
Bought by
Wacaster Thomas A
Create a Home Valuation Report for This Property
The Home Valuation Report is an in-depth analysis detailing your home's value as well as a comparison with similar homes in the area
Home Values in the Area
Average Home Value in this Area
Purchase History
| Date | Buyer | Sale Price | Title Company |
|---|---|---|---|
| Gurerrero Tania E | $240,000 | First American Title | |
| Mtglq Investor Lp | $1,000 | None Available | |
| Murcia Mirna | $314,000 | -- | |
| Gajardo Sergio L | $176,000 | -- | |
| Wacaster Thomas A | $60,000 | -- |
Source: Public Records
Mortgage History
| Date | Status | Borrower | Loan Amount |
|---|---|---|---|
| Previous Owner | Murcia Mirna | $251,200 |
Source: Public Records
Tax History Compared to Growth
Tax History
| Year | Tax Paid | Tax Assessment Tax Assessment Total Assessment is a certain percentage of the fair market value that is determined by local assessors to be the total taxable value of land and additions on the property. | Land | Improvement |
|---|---|---|---|---|
| 2025 | $7,215 | $375,000 | $192,500 | $182,500 |
| 2024 | $10,655 | $375,000 | $192,500 | $182,500 |
| 2023 | $10,655 | $33,900 | $8,000 | $25,900 |
| 2022 | $10,366 | $33,900 | $8,000 | $25,900 |
| 2021 | $10,152 | $33,900 | $8,000 | $25,900 |
| 2020 | $9,923 | $33,900 | $8,000 | $25,900 |
| 2019 | $9,051 | $31,400 | $8,000 | $23,400 |
| 2018 | $8,963 | $31,400 | $8,000 | $23,400 |
| 2017 | $8,713 | $31,400 | $8,000 | $23,400 |
| 2016 | $8,713 | $31,400 | $8,000 | $23,400 |
| 2015 | $8,195 | $31,400 | $8,000 | $23,400 |
| 2014 | $7,949 | $31,400 | $8,000 | $23,400 |
Source: Public Records
Map
Nearby Homes
- 433 Linden Ave
- 428 Jersey Unit 1
- 515 Pennington St
- 455 W End Ave Unit 457
- 515-517 W End Ave
- 322 Pennington St
- 827 Murray St Unit 829
- 821 Jersey Ave Unit 1L
- 349 W Grand St Unit 206
- 747 Rahway Ave Unit 49
- 816 W Grand St Unit 3G
- 816 W Grand St Unit 3C
- 816-826 W Grand St Unit 2C
- 12 Watson Ave
- 857 859pennington St
- 706 Cedar Ave Unit 710
- 515 Richford Terrace Unit 24
- 355 Rahway Ave
- 224 Edgar Place Unit 26
- 761 Cedar Ave
- 521 Linden Ave
- 517 Linden Ave Unit 519
- 515 Linden Ave Unit 17
- 525 Linden Ave Unit 527
- 101 Claremont Terrace
- 11 Claremont Terrace
- 513 Linden Ave Unit 515
- 527-529 Linden Ave
- 527 Linden Ave Unit 529
- 102 Claremont Terrace Unit 1
- 10 Claremont Terrace
- 522-PT Linden Ave Unit 2
- 13 Claremont Terrace
- 526 28 Linden Ave Unit 1
- 526 28 Linden Ave Unit 2
- 526 28 Linden Ave
- 12 Claremont Terrace
- 531 Linden Ave
- 509 Linden Ave Unit 511
- 544 Linden Ave