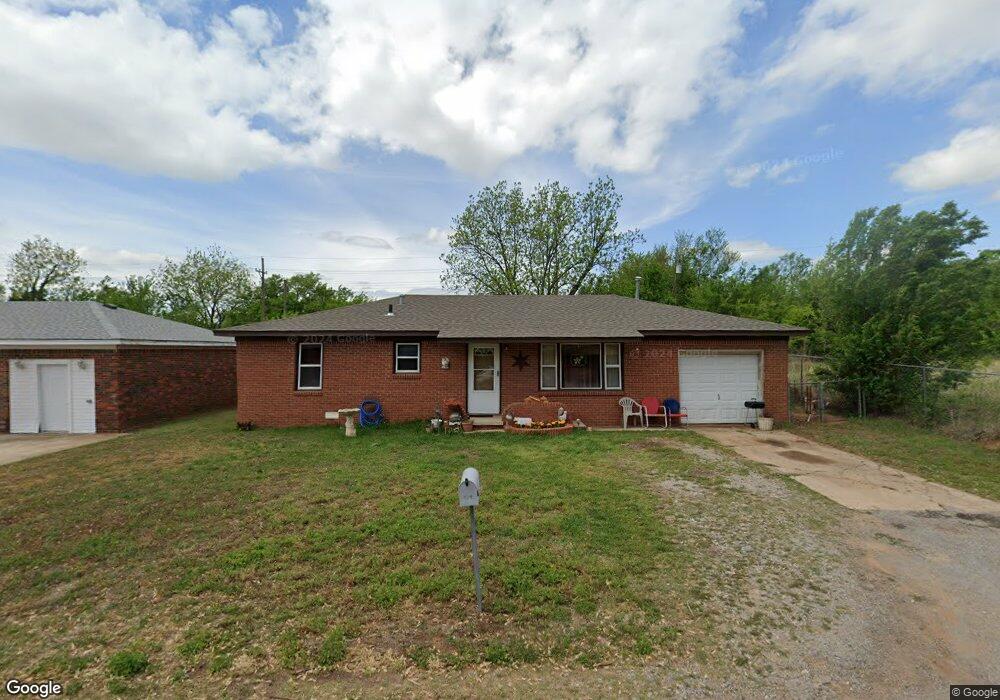
519 N L St Duncan, OK 73533
Estimated Value: $60,000 - $66,049
2
Beds
1
Bath
1,080
Sq Ft
$59/Sq Ft
Est. Value
About This Home
This home is located at 519 N L St, Duncan, OK 73533 and is currently estimated at $64,012, approximately $59 per square foot. 519 N L St is a home located in Stephens County with nearby schools including Woodrow Wilson Elementary School, Duncan Middle School, and Duncan High School.
Ownership History
Date
Name
Owned For
Owner Type
Purchase Details
Closed on
Oct 7, 2022
Sold by
Alpg Properties Llc
Bought by
Ellis Riley Cade
Current Estimated Value
Purchase Details
Closed on
Feb 21, 2007
Sold by
Treup Fred and Doe Jane
Bought by
Alpg Properties Llc
Home Financials for this Owner
Home Financials are based on the most recent Mortgage that was taken out on this home.
Original Mortgage
$27,347
Interest Rate
6.21%
Mortgage Type
Purchase Money Mortgage
Purchase Details
Closed on
Aug 19, 2005
Sold by
Wiseley Donald
Bought by
Tredup Fred
Home Financials for this Owner
Home Financials are based on the most recent Mortgage that was taken out on this home.
Original Mortgage
$9,400
Interest Rate
5.78%
Mortgage Type
New Conventional
Purchase Details
Closed on
Sep 26, 1998
Sold by
Howard Gary M
Create a Home Valuation Report for This Property
The Home Valuation Report is an in-depth analysis detailing your home's value as well as a comparison with similar homes in the area
Home Values in the Area
Average Home Value in this Area
Purchase History
| Date | Buyer | Sale Price | Title Company |
|---|---|---|---|
| Ellis Riley Cade | $105,000 | -- | |
| Ellis Riley Cade | $105,000 | None Listed On Document | |
| Alpg Properties Llc | $37,600 | None Available | |
| Tredup Fred | $47,000 | None Available | |
| -- | -- | -- |
Source: Public Records
Mortgage History
| Date | Status | Borrower | Loan Amount |
|---|---|---|---|
| Previous Owner | Alpg Properties Llc | $27,347 | |
| Previous Owner | Tredup Fred | $9,400 |
Source: Public Records
Tax History Compared to Growth
Tax History
| Year | Tax Paid | Tax Assessment Tax Assessment Total Assessment is a certain percentage of the fair market value that is determined by local assessors to be the total taxable value of land and additions on the property. | Land | Improvement |
|---|---|---|---|---|
| 2025 | $343 | $4,061 | $451 | $3,610 |
| 2024 | $329 | $3,867 | $451 | $3,416 |
| 2023 | $329 | $3,868 | $451 | $3,417 |
| 2022 | $298 | $3,508 | $451 | $3,057 |
| 2021 | $286 | $3,364 | $451 | $2,913 |
| 2020 | $303 | $3,514 | $451 | $3,063 |
| 2019 | $290 | $3,347 | $451 | $2,896 |
| 2018 | $308 | $3,454 | $451 | $3,003 |
| 2017 | $330 | $3,840 | $451 | $3,389 |
| 2016 | $389 | $4,578 | $451 | $4,127 |
| 2015 | $433 | $4,578 | $451 | $4,127 |
| 2014 | $433 | $4,578 | $451 | $4,127 |
Source: Public Records
Map
Nearby Homes