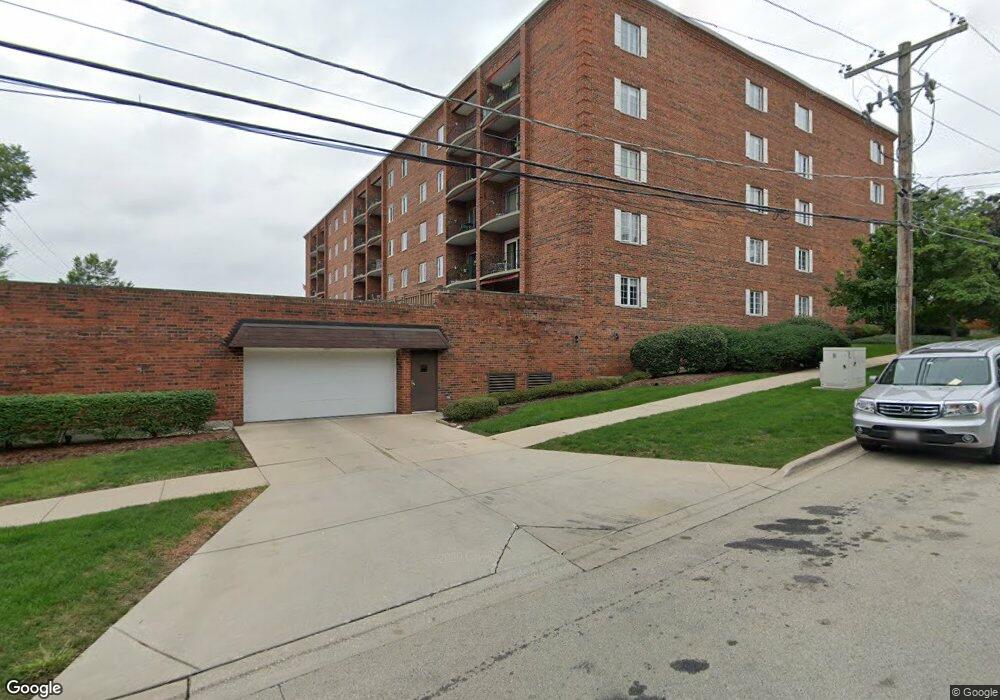
519 N Main St Unit 4 Glen Ellyn, IL 60137
Estimated Value: $333,498 - $434,000
2
Beds
2
Baths
1,325
Sq Ft
$293/Sq Ft
Est. Value
About This Home
This home is located at 519 N Main St Unit 4, Glen Ellyn, IL 60137 and is currently estimated at $388,125, approximately $292 per square foot. 519 N Main St Unit 4 is a home located in DuPage County with nearby schools including Forest Glen Elementary School, Hadley Junior High School, and Glenbard West High School.
Ownership History
Date
Name
Owned For
Owner Type
Purchase Details
Closed on
May 23, 2017
Sold by
Gonzales David and Gonzales Catherine A
Bought by
Livi Pauly Eleanor E and Eleanor E Pauly Revocable Living Trust
Current Estimated Value
Purchase Details
Closed on
Aug 26, 2013
Sold by
Coronelli Thomas and Coronelli Elizabeth
Bought by
Gonzales David and Gonzales Catherine A
Home Financials for this Owner
Home Financials are based on the most recent Mortgage that was taken out on this home.
Original Mortgage
$50,000
Interest Rate
3.5%
Mortgage Type
New Conventional
Purchase Details
Closed on
Jun 18, 2012
Sold by
Pierce Martha M
Bought by
Coronelli Thomas and Coronelli Elizabeth
Home Financials for this Owner
Home Financials are based on the most recent Mortgage that was taken out on this home.
Original Mortgage
$127,500
Interest Rate
2.12%
Mortgage Type
Adjustable Rate Mortgage/ARM
Create a Home Valuation Report for This Property
The Home Valuation Report is an in-depth analysis detailing your home's value as well as a comparison with similar homes in the area
Home Values in the Area
Average Home Value in this Area
Purchase History
| Date | Buyer | Sale Price | Title Company |
|---|---|---|---|
| Livi Pauly Eleanor E | -- | Attrneys Title Guaranty Fund | |
| Gonzales David | $215,000 | Attorneys Title Guaranty Fun | |
| Coronelli Thomas | $127,500 | Pntn |
Source: Public Records
Mortgage History
| Date | Status | Borrower | Loan Amount |
|---|---|---|---|
| Previous Owner | Gonzales David | $50,000 | |
| Previous Owner | Coronelli Thomas | $127,500 |
Source: Public Records
Tax History
| Year | Tax Paid | Tax Assessment Tax Assessment Total Assessment is a certain percentage of the fair market value that is determined by local assessors to be the total taxable value of land and additions on the property. | Land | Improvement |
|---|---|---|---|---|
| 2024 | $5,592 | $94,267 | $13,243 | $81,024 |
| 2023 | $5,269 | $86,770 | $12,190 | $74,580 |
| 2022 | $5,591 | $85,670 | $8,150 | $77,520 |
| 2021 | $5,363 | $83,640 | $7,960 | $75,680 |
| 2020 | $5,251 | $82,860 | $7,890 | $74,970 |
| 2019 | $5,118 | $80,670 | $7,680 | $72,990 |
| 2018 | $4,442 | $65,980 | $6,930 | $59,050 |
| 2017 | $4,097 | $60,010 | $6,300 | $53,710 |
| 2016 | $4,140 | $57,610 | $6,050 | $51,560 |
| 2015 | $4,116 | $54,960 | $5,770 | $49,190 |
| 2014 | $4,972 | $63,000 | $5,730 | $57,270 |
| 2013 | $4,841 | $63,190 | $5,750 | $57,440 |
Source: Public Records
Map
Nearby Homes
- 530 Anthony St Unit 530
- 465 Cottage Ave
- 441 N Park Blvd Unit 4B
- 441 N Park Blvd Unit 5K
- 445 N Park Blvd Unit 3F
- 404 Melrose Ave Unit 103
- 701 Willis St
- 671 Prairie Ave
- 488 Newton Ave
- 563 Taylor Ave
- 459 Hill Ave
- 579 Lee St
- 490 Carleton Ave
- 731 Western Ave
- 580 Oak St
- 388 Hill Ave
- 646 Riford Rd
- 305 Maple St
- 540 Elm St
- 692 Chidester Ave
- 519 N Main St Unit 3FN
- 519 N Main St Unit 1BN
- 519 N Main St Unit 5FN
- 519 N Main St Unit 4AN
- 519 N Main St Unit 5CN
- 519 N Main St Unit 1CN
- 519 N Main St Unit 1EN
- 519 N Main St Unit 4FN
- 519 N Main St Unit 1AN
- 519 N Main St Unit 3EN
- 519 N Main St Unit 3
- 519 N Main St Unit 2BN
- 519 N Main St Unit 2CN
- 519 N Main St Unit 2DN
- 519 N Main St Unit 5EN
- 519 N Main St Unit 4CN
- 519 N Main St Unit 5A
- 519 N Main St Unit 2AN
- 519 N Main St Unit 5DN
- 519 N Main St Unit 1DN
Your Personal Tour Guide
Ask me questions while you tour the home.