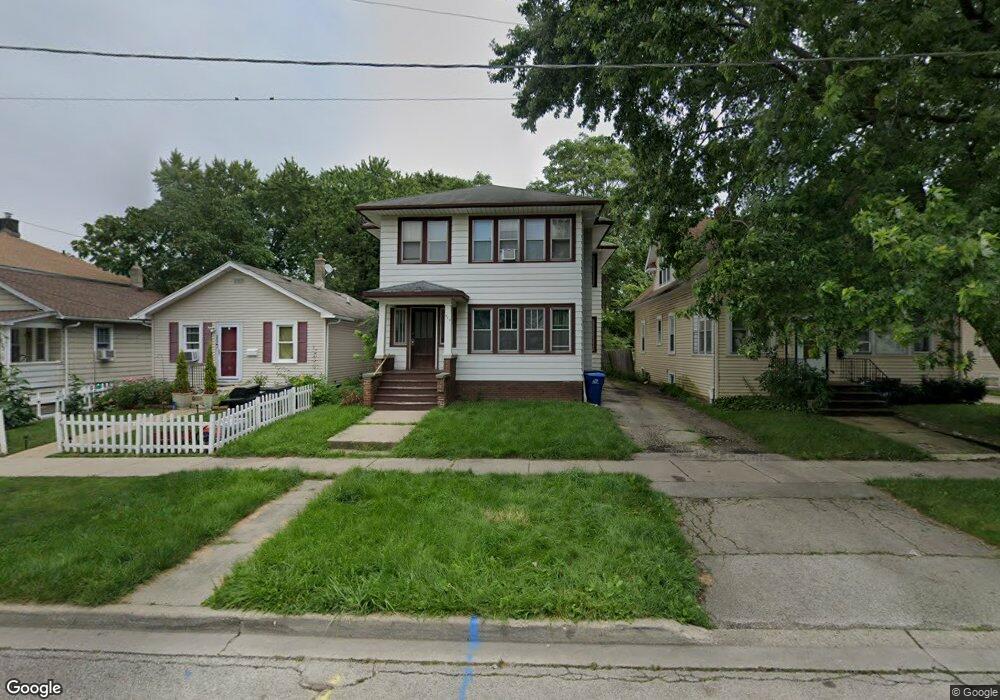
519 N Poplar St Waukegan, IL 60085
Estimated Value: $258,000 - $314,000
6
Beds
2
Baths
3,140
Sq Ft
$90/Sq Ft
Est. Value
About This Home
This home is located at 519 N Poplar St, Waukegan, IL 60085 and is currently estimated at $282,279, approximately $89 per square foot. 519 N Poplar St is a home located in Lake County with nearby schools including Glen Flora Elementary School, Edith M Smith Middle School, and Waukegan High School.
Ownership History
Date
Name
Owned For
Owner Type
Purchase Details
Closed on
Nov 14, 2005
Sold by
Deal Stuart R and Deal Helen A
Bought by
Mahlum Gregory R and Mahlum Patricia G
Current Estimated Value
Home Financials for this Owner
Home Financials are based on the most recent Mortgage that was taken out on this home.
Original Mortgage
$150,400
Outstanding Balance
$83,211
Interest Rate
6.2%
Mortgage Type
Commercial
Estimated Equity
$199,068
Purchase Details
Closed on
Mar 10, 2005
Sold by
First Midwest Bank
Bought by
Deal Stuart R and Deal Helen A
Create a Home Valuation Report for This Property
The Home Valuation Report is an in-depth analysis detailing your home's value as well as a comparison with similar homes in the area
Home Values in the Area
Average Home Value in this Area
Purchase History
| Date | Buyer | Sale Price | Title Company |
|---|---|---|---|
| Mahlum Gregory R | $188,000 | Nat | |
| Deal Stuart R | -- | -- |
Source: Public Records
Mortgage History
| Date | Status | Borrower | Loan Amount |
|---|---|---|---|
| Open | Mahlum Gregory R | $150,400 |
Source: Public Records
Tax History Compared to Growth
Tax History
| Year | Tax Paid | Tax Assessment Tax Assessment Total Assessment is a certain percentage of the fair market value that is determined by local assessors to be the total taxable value of land and additions on the property. | Land | Improvement |
|---|---|---|---|---|
| 2024 | $7,534 | $88,641 | $6,671 | $81,970 |
| 2023 | $7,226 | $79,899 | $5,973 | $73,926 |
| 2022 | $7,226 | $73,919 | $5,681 | $68,238 |
| 2021 | $6,631 | $63,605 | $5,068 | $58,537 |
| 2020 | $6,717 | $59,255 | $4,721 | $54,534 |
| 2019 | $6,760 | $54,298 | $4,326 | $49,972 |
| 2018 | $6,398 | $49,485 | $5,511 | $43,974 |
| 2017 | $6,228 | $43,781 | $4,876 | $38,905 |
| 2016 | $5,879 | $38,044 | $4,237 | $33,807 |
| 2015 | $5,752 | $34,050 | $3,792 | $30,258 |
| 2014 | $5,710 | $33,749 | $3,068 | $30,681 |
| 2012 | $7,077 | $36,563 | $3,323 | $33,240 |
Source: Public Records
Map
Nearby Homes
- 428 N Poplar St
- 522 N Poplar St
- 511 Chestnut St
- 702 Franklin St
- 620 N Poplar St
- 452 North Ave
- 325 4th St
- 918 N Ash St
- 509 N Butrick St
- 723 N County St
- 1109 Massena Ave
- 917 N Linden Ave
- 222 Grand Ave
- 611 N Genesee St
- 28 N Saint James St
- 415 W Ridgeland Ave
- 824 N Butrick St
- 1110 N Ash St
- 23 N Jackson St
- 1122 N Ash St