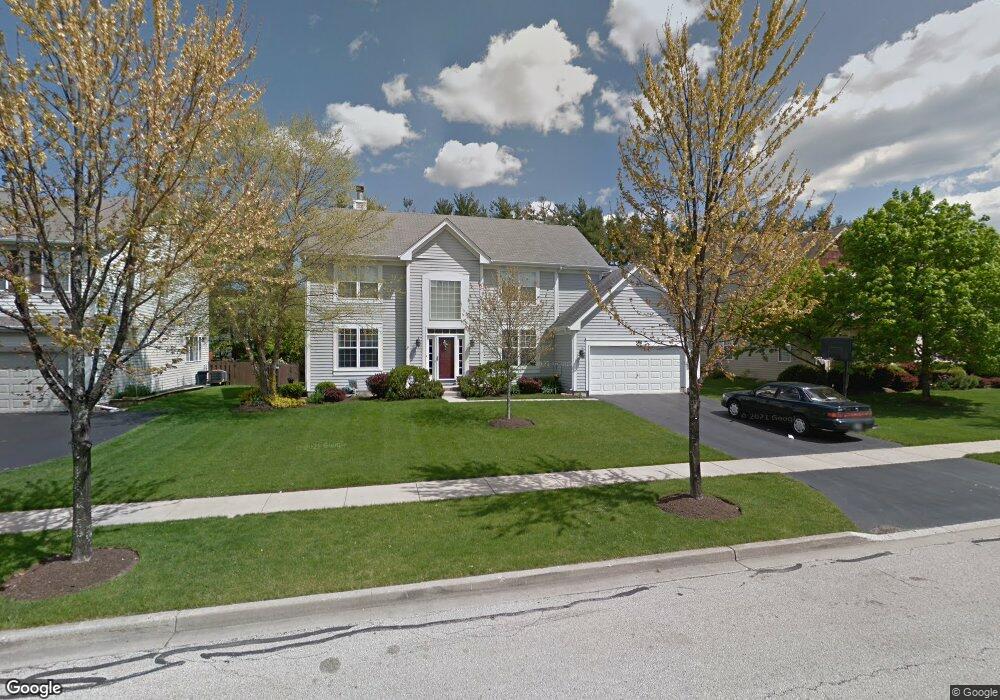
519 Old Walnut Cir Unit 1 Gurnee, IL 60031
Estimated Value: $527,996 - $609,000
4
Beds
3
Baths
2,769
Sq Ft
$205/Sq Ft
Est. Value
About This Home
This home is located at 519 Old Walnut Cir Unit 1, Gurnee, IL 60031 and is currently estimated at $566,749, approximately $204 per square foot. 519 Old Walnut Cir Unit 1 is a home located in Lake County with nearby schools including Woodland Primary School, Woodland Elementary School, and Woodland Intermediate School.
Ownership History
Date
Name
Owned For
Owner Type
Purchase Details
Closed on
Jun 28, 2019
Sold by
Zetek Glenn R and Zetek Beth N
Bought by
Zetek Glenn and Zetek Beth N
Current Estimated Value
Purchase Details
Closed on
Jan 10, 2002
Sold by
Senning Daniel A and Daniel A Senning Trust
Bought by
Zetek Glenn R and Zetek Beth N
Home Financials for this Owner
Home Financials are based on the most recent Mortgage that was taken out on this home.
Original Mortgage
$225,000
Interest Rate
6.93%
Purchase Details
Closed on
Feb 6, 2001
Sold by
Senning Daniel A and Senning Suzanne A
Bought by
Senning Daniel A and Senning Suzanne A
Purchase Details
Closed on
Jan 20, 1999
Sold by
The Northern Trust Company
Bought by
Senning Daniel A and Senning Suzanne A
Home Financials for this Owner
Home Financials are based on the most recent Mortgage that was taken out on this home.
Original Mortgage
$193,000
Interest Rate
6.92%
Create a Home Valuation Report for This Property
The Home Valuation Report is an in-depth analysis detailing your home's value as well as a comparison with similar homes in the area
Home Values in the Area
Average Home Value in this Area
Purchase History
| Date | Buyer | Sale Price | Title Company |
|---|---|---|---|
| Zetek Glenn | -- | Attorney | |
| Zetek Glenn R | $375,000 | -- | |
| Senning Daniel A | -- | -- | |
| Senning Daniel A | $293,000 | First American Title |
Source: Public Records
Mortgage History
| Date | Status | Borrower | Loan Amount |
|---|---|---|---|
| Previous Owner | Zetek Glenn R | $225,000 | |
| Previous Owner | Senning Daniel A | $193,000 |
Source: Public Records
Tax History Compared to Growth
Tax History
| Year | Tax Paid | Tax Assessment Tax Assessment Total Assessment is a certain percentage of the fair market value that is determined by local assessors to be the total taxable value of land and additions on the property. | Land | Improvement |
|---|---|---|---|---|
| 2024 | $12,197 | $142,299 | $23,127 | $119,172 |
| 2023 | $11,115 | $132,114 | $21,472 | $110,642 |
| 2022 | $11,115 | $120,033 | $21,478 | $98,555 |
| 2021 | $10,047 | $115,217 | $20,616 | $94,601 |
| 2020 | $9,724 | $112,385 | $20,109 | $92,276 |
| 2019 | $9,447 | $109,122 | $19,525 | $89,597 |
| 2018 | $10,246 | $119,245 | $22,936 | $96,309 |
| 2017 | $10,138 | $115,828 | $22,279 | $93,549 |
| 2016 | $10,061 | $110,671 | $21,287 | $89,384 |
| 2015 | $9,803 | $104,961 | $20,189 | $84,772 |
| 2014 | $9,601 | $103,619 | $19,930 | $83,689 |
| 2012 | $9,096 | $104,413 | $20,083 | $84,330 |
Source: Public Records
Map
Nearby Homes
- 7449 Brentwood Ln
- 7437 Bittersweet Dr
- 767 Aster Dr
- 7390 Bittersweet Dr
- 415 Kingsport Dr
- 18466 W Springwood Dr
- 699 Snow Cap Ct
- 1090 Village Ln
- 34395 W Saddle Ct
- 17716 W Horseshoe Ln Unit 3
- 18587 W Meander Dr
- 17490 Pin Oak Ln
- 35051 N Oak Knoll Cir
- 17444 Pin Oak Ln
- 1075 Suffolk Ct
- 1094 Vista Dr
- 34871 N Lake Shore Dr
- 34271 N Tangueray Dr
- 18238 W Gages Lake Rd
- 17404 W Walnut Ln Unit 2C
- 531 Old Walnut Cir
- 507 Old Walnut Cir
- 540 Prescott Ln
- 495 Old Walnut Cir
- 548 Prescott Ln Unit 3
- 543 Old Walnut Cir
- 532 Prescott Ln
- 516 Old Walnut Cir
- 504 Old Walnut Cir
- 556 Prescott Ln
- 524 Prescott Ln
- 483 Old Walnut Cir
- 555 Old Walnut Cir
- 492 Old Walnut Cir
- 7380 Bradford Ct
- 564 Prescott Ln
- 516 Prescott Ln Unit 3
- 7399 Bradford Ct
- 480 Old Walnut Cir
- 471 Old Walnut Cir