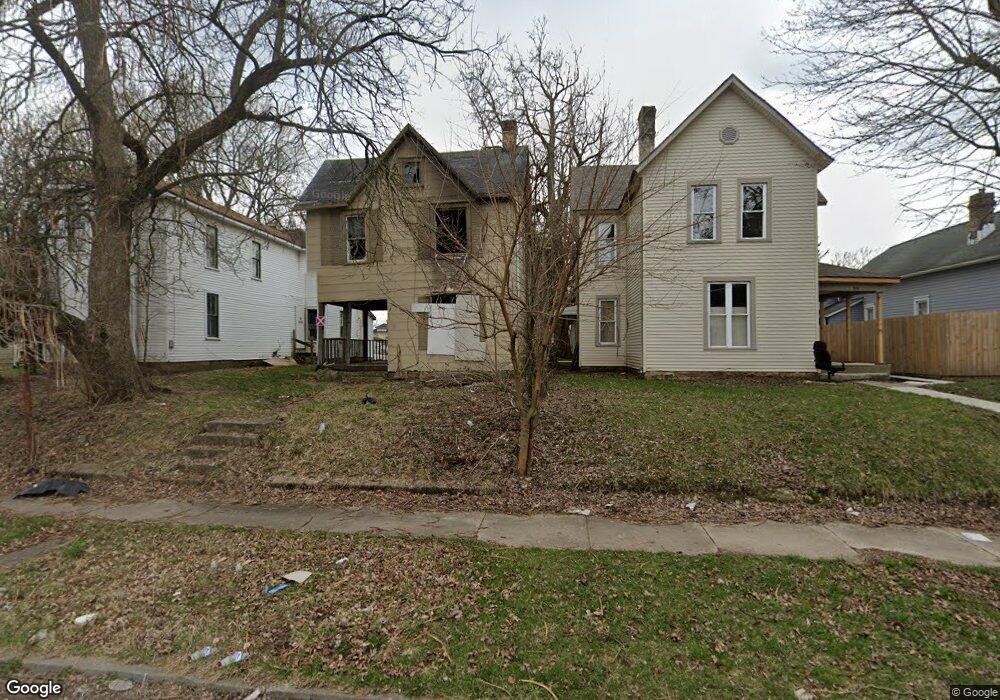
519 Rice St Springfield, OH 45505
Estimated Value: $77,000 - $342,000
4
Beds
1
Bath
1,302
Sq Ft
$137/Sq Ft
Est. Value
About This Home
This home is located at 519 Rice St, Springfield, OH 45505 and is currently estimated at $178,667, approximately $137 per square foot. 519 Rice St is a home located in Clark County with nearby schools including Lincoln Elementary School, Hayward Middle School, and Springfield High School.
Ownership History
Date
Name
Owned For
Owner Type
Purchase Details
Closed on
Feb 11, 2021
Sold by
Talbert Mary P and Talbert Mary
Bought by
Under Gods Roof Llc
Current Estimated Value
Purchase Details
Closed on
Oct 6, 2020
Sold by
Estate Of Michael E Talbert
Bought by
Talbert Mary P and Talbert Mary
Purchase Details
Closed on
Jul 26, 2010
Sold by
Bank Of America National Association
Bought by
Talbert Michael and Talbert Mary P
Purchase Details
Closed on
Jan 6, 2010
Sold by
Cornelison Brant
Bought by
Bank Of America National Association
Purchase Details
Closed on
Jul 5, 2006
Sold by
Abn Amro Mortgage Group
Bought by
Cornelison Brant
Purchase Details
Closed on
Feb 15, 2006
Sold by
Va
Bought by
Abn Amro Mortgage Group
Purchase Details
Closed on
Nov 16, 2005
Sold by
Holloway Robert L
Bought by
Va
Purchase Details
Closed on
Mar 1, 1980
Sold by
Dewitt Lillian and Dewitt Harry
Bought by
Holloway Robert L and Holloway Mary D
Create a Home Valuation Report for This Property
The Home Valuation Report is an in-depth analysis detailing your home's value as well as a comparison with similar homes in the area
Home Values in the Area
Average Home Value in this Area
Purchase History
| Date | Buyer | Sale Price | Title Company |
|---|---|---|---|
| Under Gods Roof Llc | -- | None Available | |
| Talbert Mary P | -- | None Available | |
| Talbert Michael | $2,400 | Resource Title Agency Of Cin | |
| Bank Of America National Association | $23,400 | None Available | |
| Cornelison Brant | $12,000 | Accutitle Agency Inc | |
| Abn Amro Mortgage Group | -- | None Available | |
| Va | $8,000 | None Available | |
| Holloway Robert L | $24,000 | -- |
Source: Public Records
Tax History
| Year | Tax Paid | Tax Assessment Tax Assessment Total Assessment is a certain percentage of the fair market value that is determined by local assessors to be the total taxable value of land and additions on the property. | Land | Improvement |
|---|---|---|---|---|
| 2025 | $25,469 | $700 | $700 | -- |
| 2024 | $32,458 | $610 | $610 | -- |
| 2023 | $17,541 | $610 | $610 | $0 |
| 2022 | $21,977 | $9,010 | $950 | $8,060 |
| 2021 | $416 | $7,570 | $790 | $6,780 |
| 2020 | $417 | $7,570 | $790 | $6,780 |
| 2019 | $418 | $7,570 | $790 | $6,780 |
| 2018 | $564 | $9,800 | $840 | $8,960 |
| 2017 | $563 | $9,797 | $840 | $8,957 |
| 2016 | $564 | $9,797 | $840 | $8,957 |
| 2015 | $10,034 | $9,513 | $840 | $8,673 |
| 2014 | $556 | $9,513 | $840 | $8,673 |
| 2013 | $7,025 | $9,513 | $840 | $8,673 |
Source: Public Records
Map
Nearby Homes
- 550 E Rose St
- 1502 Linden Ave
- 230 Rice St
- 652 E Southern Ave
- 441 E Euclid Ave
- 1008 Tibbetts Ave
- 900 E Rose St
- 205 E Grand Ave
- 1417 Clifton Ave Unit 1419
- 1724 Clay St
- 1820 Clay St
- 1823 Clay St
- 0 W Perrin Ave Unit 1043508
- 0 W Perrin Ave Unit 951292
- 1355 S Fountain Ave
- 705 York St
- 907-913 S Limestone St
- 1111 Lafayette Ave
- 625 Tibbetts Ave
- 1846 Ohio Ave
Your Personal Tour Guide
Ask me questions while you tour the home.