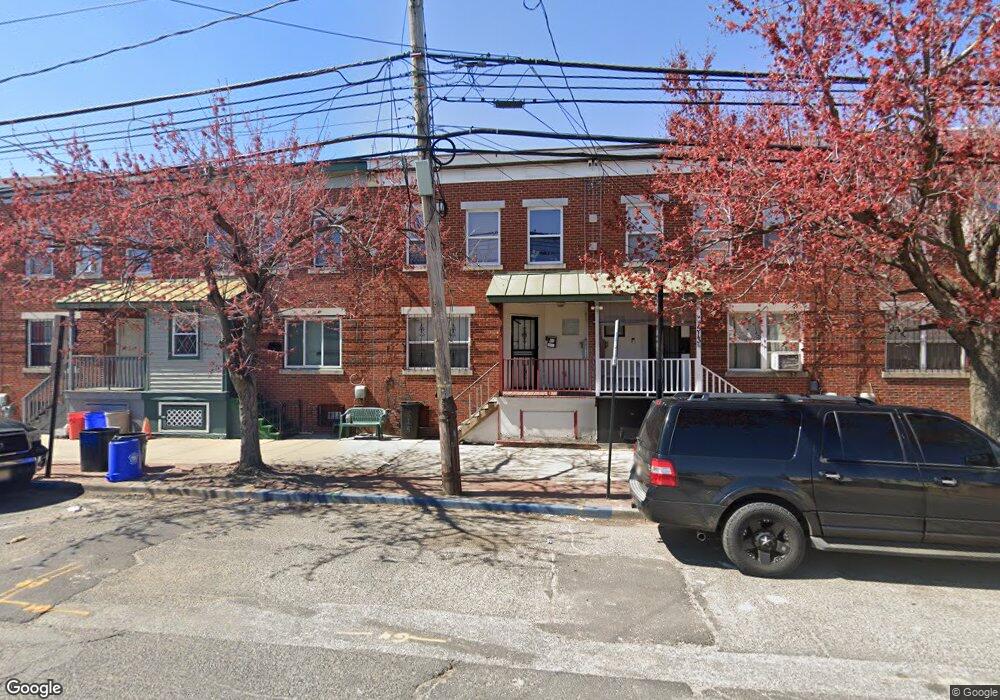
519 S 6th St Camden, NJ 08103
Lanning Square NeighborhoodEstimated Value: $183,000 - $296,000
3
Beds
1
Bath
1,266
Sq Ft
$175/Sq Ft
Est. Value
About This Home
This home is located at 519 S 6th St, Camden, NJ 08103 and is currently estimated at $221,331, approximately $174 per square foot. 519 S 6th St is a home located in Camden County with nearby schools including Camden High School, Hope Community Charter School, and Leap Academy University Charter School.
Ownership History
Date
Name
Owned For
Owner Type
Purchase Details
Closed on
Apr 3, 2017
Sold by
Wu Le Guo
Bought by
Wu Property Investment Llc
Current Estimated Value
Purchase Details
Closed on
Mar 31, 2016
Sold by
Ccts Tax Liens Llc
Bought by
Wu Home Remodeling Llc
Purchase Details
Closed on
Feb 6, 2009
Sold by
Buckborn Rebecca
Bought by
Evans Dozier
Purchase Details
Closed on
Jan 3, 1994
Sold by
Camden City Redevel Corp
Bought by
Buchborn Rebecca
Home Financials for this Owner
Home Financials are based on the most recent Mortgage that was taken out on this home.
Original Mortgage
$44,000
Interest Rate
7.11%
Mortgage Type
Purchase Money Mortgage
Create a Home Valuation Report for This Property
The Home Valuation Report is an in-depth analysis detailing your home's value as well as a comparison with similar homes in the area
Home Values in the Area
Average Home Value in this Area
Purchase History
| Date | Buyer | Sale Price | Title Company |
|---|---|---|---|
| Wu Property Investment Llc | -- | None Available | |
| Wu Home Remodeling Llc | $53,326 | None Available | |
| Evans Dozier | -- | -- | |
| Buchborn Rebecca | $55,000 | -- |
Source: Public Records
Mortgage History
| Date | Status | Borrower | Loan Amount |
|---|---|---|---|
| Previous Owner | Buchborn Rebecca | $44,000 |
Source: Public Records
Tax History Compared to Growth
Tax History
| Year | Tax Paid | Tax Assessment Tax Assessment Total Assessment is a certain percentage of the fair market value that is determined by local assessors to be the total taxable value of land and additions on the property. | Land | Improvement |
|---|---|---|---|---|
| 2025 | $3,175 | $89,600 | $7,300 | $82,300 |
| 2024 | $3,069 | $89,600 | $7,300 | $82,300 |
| 2023 | $3,069 | $89,600 | $7,300 | $82,300 |
| 2022 | $3,011 | $89,600 | $7,300 | $82,300 |
| 2021 | $3,001 | $89,600 | $7,300 | $82,300 |
| 2020 | $2,849 | $89,600 | $7,300 | $82,300 |
| 2019 | $2,728 | $89,600 | $7,300 | $82,300 |
| 2018 | $2,714 | $89,600 | $7,300 | $82,300 |
| 2017 | $2,648 | $89,600 | $7,300 | $82,300 |
| 2016 | $2,563 | $89,600 | $7,300 | $82,300 |
| 2015 | $2,468 | $89,600 | $7,300 | $82,300 |
| 2014 | $2,408 | $89,600 | $7,300 | $82,300 |
Source: Public Records
Map
Nearby Homes