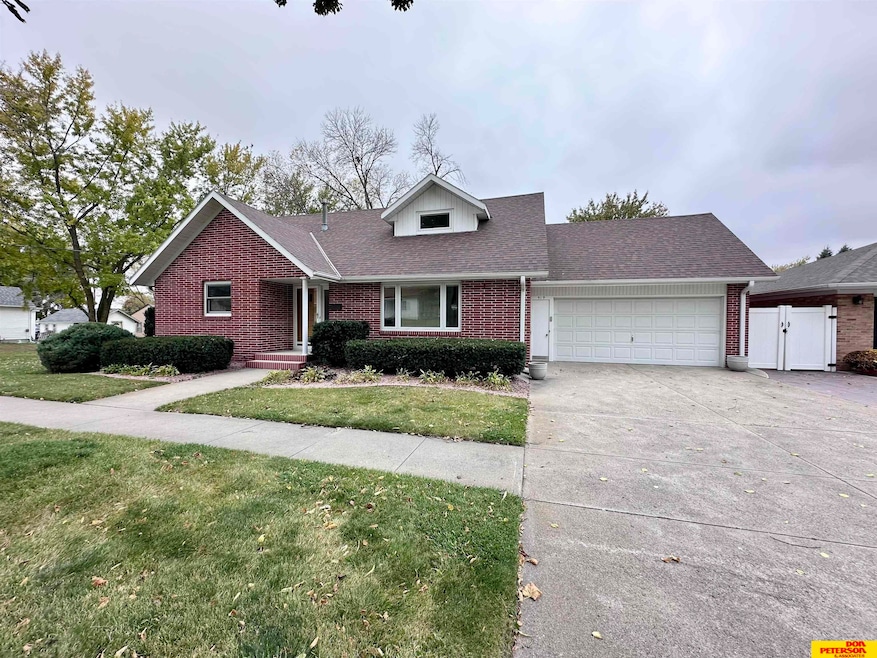
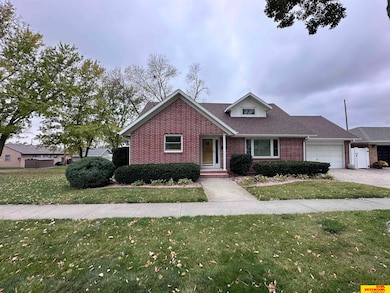
519 S Niphon St West Point, NE 68788
Estimated payment $1,971/month
Highlights
- Hot Property
- Wood Flooring
- No HOA
- Second Kitchen
- Main Floor Primary Bedroom
- Porch
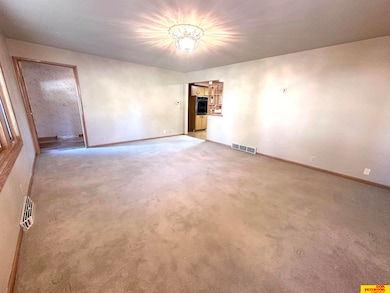
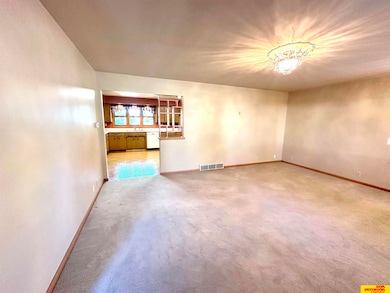
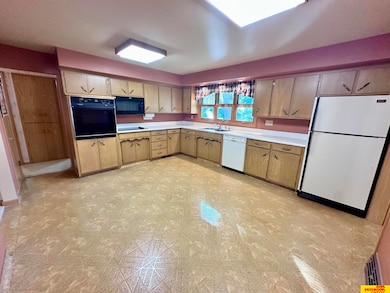
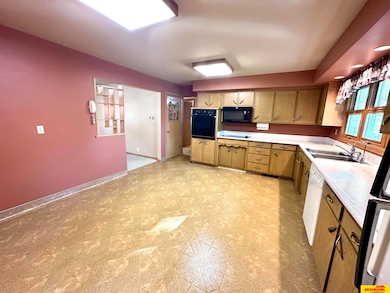
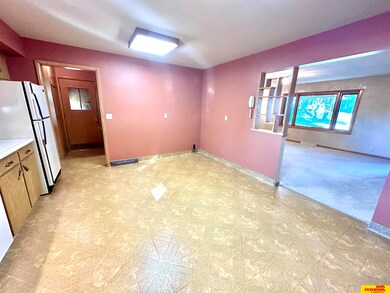
About This Home
Spacious & solid brick beauty with endless possibilities and room to grow! The main floor features a spacious living room that flows into a large eat-in kitchen. 2 bedrooms with great closet space, a 3/4 bath, laundry and small drop zone off the garage. Upstairs you'll find 3 additional bedrooms with walk-in closets (1 cedar) a clothes chute, beautiful hardwood floors & 3/4 bath. The basement offers a generous family room with built in storage, walk out patio, a roomy kitchenette, 1/2 bath & storage room. With it's solid structure & great layout this home offers good bones & a wonderful opportunity for buyers to bring their vision & make it their own. Bonus Lot to the South if full of possibilities.
Listing Agent
Don Peterson & Associates R E Brokerage Phone: 402-721-9700 License #20170301 Listed on: 10/27/2025
Home Details
Home Type
- Single Family
Est. Annual Taxes
- $2,290
Year Built
- Built in 1963
Lot Details
- 0.39 Acre Lot
- Paved or Partially Paved Lot
Parking
- 2 Car Attached Garage
- Garage Door Opener
Home Design
- Brick or Stone Mason
- Block Foundation
- Composition Roof
Interior Spaces
- 1.5-Story Property
- Ceiling Fan
- Two Story Entrance Foyer
- Dining Area
- Storage Room
Kitchen
- Second Kitchen
- Oven
- Cooktop
- Microwave
- Disposal
Flooring
- Wood
- Wall to Wall Carpet
- Concrete
- Tile
Bedrooms and Bathrooms
- 5 Bedrooms
- Primary Bedroom on Main
- Cedar Closet
- Walk-In Closet
Laundry
- Dryer
- Washer
Basement
- Walk-Out Basement
- Basement Windows
Outdoor Features
- Patio
- Exterior Lighting
- Porch
Location
- City Lot
Schools
- West Point Elementary School
- West Point-Beemer Middle School
- West Point-Beemer High School
Utilities
- Forced Air Heating and Cooling System
- Heating System Uses Natural Gas
- Water Purifier
Community Details
- No Home Owners Association
Listing and Financial Details
- Assessor Parcel Number 0006330.00 & 0000634000
Map
Home Values in the Area
Average Home Value in this Area
Tax History
| Year | Tax Paid | Tax Assessment Tax Assessment Total Assessment is a certain percentage of the fair market value that is determined by local assessors to be the total taxable value of land and additions on the property. | Land | Improvement |
|---|---|---|---|---|
| 2024 | $2,032 | $242,315 | $18,445 | $223,870 |
| 2023 | $2,835 | $245,645 | $16,300 | $229,345 |
| 2022 | $2,767 | $218,730 | $12,870 | $205,860 |
| 2021 | $2,568 | $192,750 | $10,725 | $182,025 |
| 2020 | $2,431 | $182,045 | $10,725 | $171,320 |
| 2019 | $2,228 | $163,075 | $10,725 | $152,350 |
| 2018 | $2,034 | $148,245 | $10,725 | $137,520 |
| 2017 | $2,080 | $148,245 | $10,725 | $137,520 |
| 2016 | $2,081 | $144,045 | $10,725 | $133,320 |
| 2015 | $2,214 | $144,045 | $10,725 | $133,320 |
| 2014 | $2,314 | $132,245 | $10,725 | $121,520 |
| 2013 | $2,314 | $132,245 | $10,725 | $121,520 |
Property History
| Date | Event | Price | List to Sale | Price per Sq Ft |
|---|---|---|---|---|
| 10/27/2025 10/27/25 | For Sale | $337,000 | -- | $136 / Sq Ft |
Source: Great Plains Regional MLS
MLS Number: 22530936
APN: 0006330.00
Disclaimer: Certain information contained herein is derived from information provided by parties other than Homes.com. All information provided is deemed reliable, but is not guaranteed to be accurate and should be independently verified.
![]() Listing information is provided by Participants of the Great Plains Regional Multiple Listing Service Inc.
Listing information is provided by Participants of the Great Plains Regional Multiple Listing Service Inc.
IDX information is provided exclusively for personal, non-commercial use, and may not be used for any purpose other than to identify prospective properties consumers may be interested in purchasing.
Information is deemed reliable but not guaranteed.
Copyright 2025, Great Plains Regional MLS LLC
