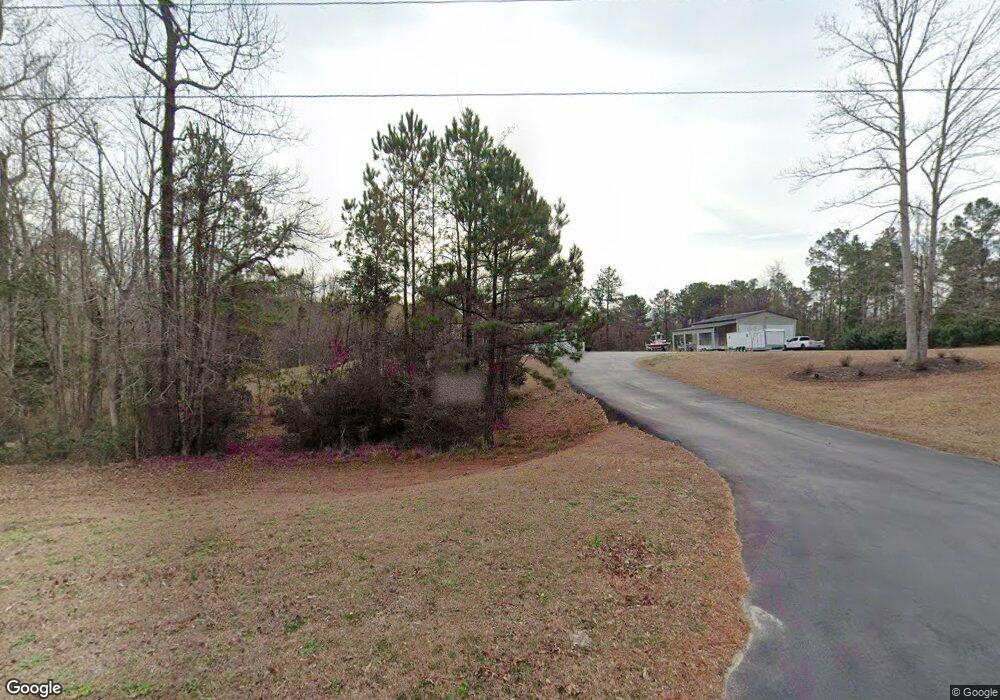
519 Swansboro Loop Rd Cape Carteret, NC 28584
Estimated Value: $395,000 - $528,368
4
Beds
2
Baths
1,878
Sq Ft
$232/Sq Ft
Est. Value
About This Home
This home is located at 519 Swansboro Loop Rd, Cape Carteret, NC 28584 and is currently estimated at $436,342, approximately $232 per square foot. 519 Swansboro Loop Rd is a home located in Onslow County with nearby schools including Swansboro Elementary School, Swansboro Middle School, and Swansboro High School.
Ownership History
Date
Name
Owned For
Owner Type
Purchase Details
Closed on
Mar 13, 2024
Sold by
Morton Elijah Timothy
Bought by
Spencer Blake and Spencer Dawn Krunich
Current Estimated Value
Home Financials for this Owner
Home Financials are based on the most recent Mortgage that was taken out on this home.
Original Mortgage
$550,000
Outstanding Balance
$541,306
Interest Rate
6.9%
Mortgage Type
VA
Estimated Equity
-$104,964
Purchase Details
Closed on
Jun 2, 2015
Sold by
Combs Gene David
Bought by
Morton Elijah Timothy
Purchase Details
Closed on
Jun 4, 2013
Sold by
Carpenter Robert L and Carpenter Lana K
Bought by
Combs Gene David
Home Financials for this Owner
Home Financials are based on the most recent Mortgage that was taken out on this home.
Original Mortgage
$148,000
Interest Rate
4.31%
Mortgage Type
Construction
Create a Home Valuation Report for This Property
The Home Valuation Report is an in-depth analysis detailing your home's value as well as a comparison with similar homes in the area
Home Values in the Area
Average Home Value in this Area
Purchase History
| Date | Buyer | Sale Price | Title Company |
|---|---|---|---|
| Spencer Blake | $550,000 | None Listed On Document | |
| Blake Spencer | $550,000 | None Listed On Document | |
| Morton Elijah Timothy | $249,000 | Attorney | |
| Combs Gene David | -- | None Available |
Source: Public Records
Mortgage History
| Date | Status | Borrower | Loan Amount |
|---|---|---|---|
| Open | Blake Spencer | $550,000 | |
| Closed | Blake Spencer | $550,000 | |
| Previous Owner | Combs Gene David | $148,000 |
Source: Public Records
Tax History Compared to Growth
Tax History
| Year | Tax Paid | Tax Assessment Tax Assessment Total Assessment is a certain percentage of the fair market value that is determined by local assessors to be the total taxable value of land and additions on the property. | Land | Improvement |
|---|---|---|---|---|
| 2025 | $1,439 | $264,644 | $45,550 | $219,094 |
| 2024 | $1,733 | $264,644 | $45,550 | $219,094 |
| 2023 | $1,733 | $264,644 | $45,550 | $219,094 |
| 2022 | $1,733 | $264,644 | $45,550 | $219,094 |
| 2021 | $1,527 | $216,640 | $40,550 | $176,090 |
| 2020 | $1,527 | $216,640 | $40,550 | $176,090 |
| 2019 | $1,527 | $216,640 | $40,550 | $176,090 |
| 2018 | $1,527 | $216,640 | $40,550 | $176,090 |
| 2017 | $1,254 | $185,750 | $36,660 | $149,090 |
| 2016 | $1,254 | $185,750 | $0 | $0 |
| 2015 | $816 | $120,880 | $0 | $0 |
| 2014 | $816 | $31,920 | $0 | $0 |
Source: Public Records
Map
Nearby Homes
- 111 Hidden Creek Dr
- 274 Norris Rd
- 109 Borough Nest Dr
- 161 Howard Ln
- 306 Limbaugh
- 140 Plantation Dr
- 637 White Oak Crossing
- 200 Low Country Ln
- 307 Joans
- 1476 W Corbett Ave
- 1223 W Corbett Ave
- 698 White Oak Crossing
- 125 River Reach Dr W
- 238 Mill Creek Rd
- 340 Belgrade Swansboro Rd
- 233 Belgrade Swansboro Rd
- 239 Belgrade Swansboro Rd
- 4 Schooner Dr
- 702 Hummingbird S Unit 702
- 354 Belgrade Swansboro Rd
- 519 Swansboro Loop Rd
- 523 Swansboro Loop Rd
- 523 Swansboro Loop Rd
- 126 Hidden Creek Dr
- 100 Walnut Dr
- 101 Walnut Dr
- 102 Walnut Dr
- 122 Hidden Creek Dr
- 536 Swansboro Loop Rd
- 540 Swansboro Loop Rd
- 103 Walnut Dr
- 123 Hidden Creek Dr
- 120 Hidden Creek Dr
- 200 Landing Ct
- 101 Ridge Cove Ln
- 121 Hidden Creek Dr
- 100 Ridge Cove Ln
- 119 Hidden Creek Dr
- 544 Swansboro Loop Rd
- 105 Walnut Dr