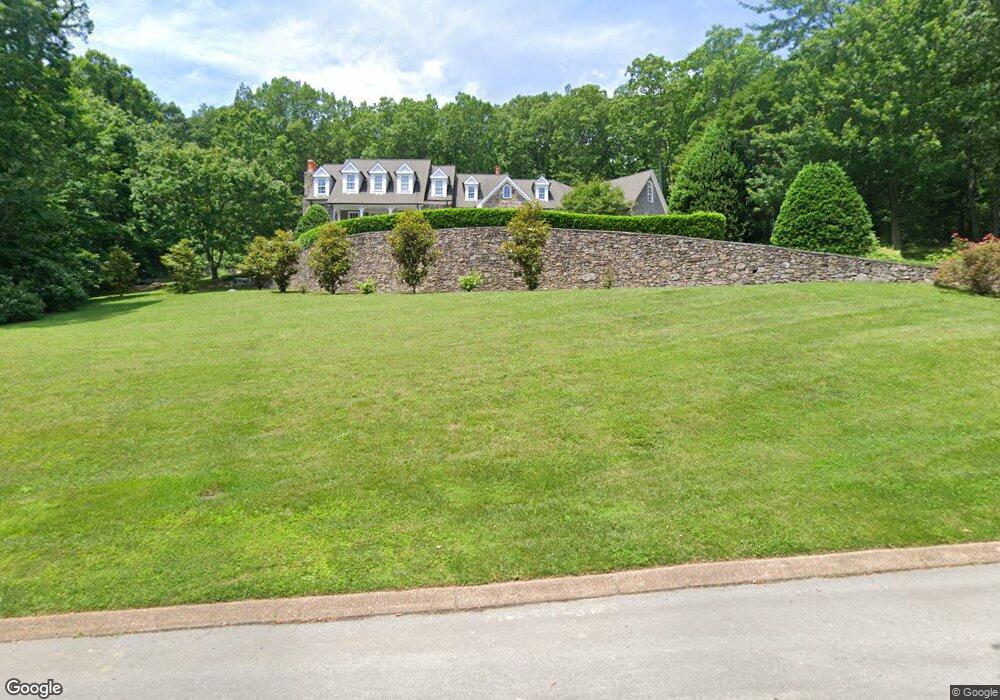
519 Turnberry Ln Unit C Lookout Mountain, GA 30750
Estimated Value: $1,247,149 - $1,730,000
--
Bed
--
Bath
4,738
Sq Ft
$330/Sq Ft
Est. Value
About This Home
This home is located at 519 Turnberry Ln Unit C, Lookout Mountain, GA 30750 and is currently estimated at $1,563,050, approximately $329 per square foot. 519 Turnberry Ln Unit C is a home located in Walker County with nearby schools including Fairyland Elementary School, Chattanooga Valley Middle School, and Ridgeland High School.
Ownership History
Date
Name
Owned For
Owner Type
Purchase Details
Closed on
Aug 20, 2004
Sold by
Northwest Georgia Bank
Bought by
Whitener Jennifer C
Current Estimated Value
Purchase Details
Closed on
Jul 6, 2004
Sold by
Brock Matthew Robinson
Bought by
Northwest Georgia Bank
Purchase Details
Closed on
Sep 8, 1997
Sold by
Johnston Tory
Bought by
Brock Matthew Robinson
Purchase Details
Closed on
May 20, 1997
Sold by
Westbrook Westbrook C and Westbrook Martha
Bought by
Johnston Tory
Purchase Details
Closed on
Oct 27, 1989
Sold by
James Allen Chency
Bought by
Westbrook Westbrook C and Westbrook Martha
Purchase Details
Closed on
Jan 1, 1972
Bought by
James Allen Chency
Create a Home Valuation Report for This Property
The Home Valuation Report is an in-depth analysis detailing your home's value as well as a comparison with similar homes in the area
Home Values in the Area
Average Home Value in this Area
Purchase History
| Date | Buyer | Sale Price | Title Company |
|---|---|---|---|
| Whitener Jennifer C | $760,000 | -- | |
| Northwest Georgia Bank | -- | -- | |
| Brock Matthew Robinson | $39,000 | -- | |
| Johnston Tory | $35,000 | -- | |
| Westbrook Westbrook C | $38,000 | -- | |
| James Allen Chency | -- | -- |
Source: Public Records
Tax History Compared to Growth
Tax History
| Year | Tax Paid | Tax Assessment Tax Assessment Total Assessment is a certain percentage of the fair market value that is determined by local assessors to be the total taxable value of land and additions on the property. | Land | Improvement |
|---|---|---|---|---|
| 2024 | $14,037 | $479,798 | $32,200 | $447,598 |
| 2023 | $13,832 | $466,759 | $32,200 | $434,559 |
| 2022 | $9,592 | $366,354 | $32,200 | $334,154 |
| 2021 | $8,869 | $303,996 | $26,880 | $277,116 |
| 2020 | $7,433 | $244,279 | $26,880 | $217,399 |
| 2019 | $7,437 | $244,279 | $26,880 | $217,399 |
| 2018 | $6,304 | $211,898 | $26,880 | $185,018 |
| 2017 | $6,667 | $202,298 | $17,280 | $185,018 |
| 2016 | $5,178 | $223,317 | $17,280 | $206,037 |
| 2015 | $5,543 | $193,552 | $32,067 | $161,484 |
| 2014 | $5,337 | $193,552 | $32,067 | $161,484 |
| 2013 | -- | $193,551 | $32,067 | $161,484 |
Source: Public Records
Map
Nearby Homes
- 1612 Lula Lake Rd
- 504 Frontier Bluff Rd
- 401 Mcfarland Rd
- 302 Mcfarland Rd
- 106 Founding Way
- 154 Founding Way Unit B
- 1601 Wood Nymph Trail
- 1613 Fairy Dell Trail
- 1300 Elfin Rd
- 31 Krupski Loop
- 1212 Cinderella Rd
- 0 Stonesthrow Ln Unit RTC2886827
- 0 Stonesthrow Ln Unit 1512290
- 0 Stonesthrow Ln Unit 1376808
- 0 Fleetwood Dr Unit RTC2957879
- 0 Fleetwood Dr Unit 1517351
- 418 Brow Wood Ln
- 0 Tinker Bell Cir Unit LOT 27 10563269
- 0 Tinker Bell Cir Unit 1510010
- 17 Turnberry Ln
- 519 Turnberry Ln
- 14142 Scenic Hwy
- 13 Turnberry Ln
- 14072 Scenic Hwy
- 15 Turnberry Ln
- 18 Turnberry Ln
- 14246 Scenic Hwy
- 15 Turnberry Ln
- 12 Turnberry Ln
- 14101 Scenic Hwy
- 9 Turnberry Ln
- 14131 Scenic Hwy
- 6 Apollo Rd
- 14195 Scenic Hwy
- 1333 Scenic Hwy
- 3 Apollo Rd
- 14 Turnberry Ln
- 383 Turnberry Ln
- 14235 Scenic Hwy