519 Vine St Oceanside, CA 92054
Downtown Oceanside NeighborhoodEstimated Value: $1,166,000 - $1,250,000
About This Home
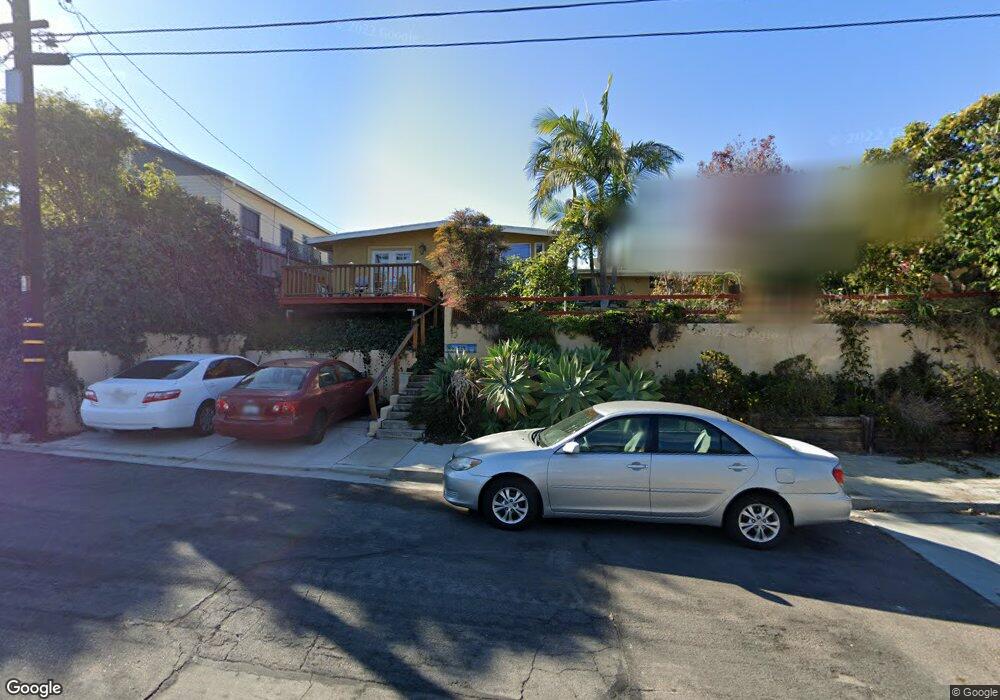
This home is located at 519 Vine St, Oceanside, CA 92054 and is currently estimated at $1,210,371, approximately $771 per square foot. 519 Vine St is a home located in San Diego County with nearby schools including Laurel Elementary School, Lincoln Middle School, and Oceanside High School.
Ownership History
We collect this data history from publicly available records. To have your information removed, we recommend requesting removal directly through your county’s website.
Purchase Details
Home Financials for this Owner
Home Financials are based on the most recent Mortgage that was taken out on this home.Purchase Details
Home Values in the Area
Average Home Value in this Area
Purchase History
We collect this data history from publicly available records. To have your information removed, we recommend requesting removal directly through your county’s website.
| Date | Buyer | Sale Price | Title Company |
|---|---|---|---|
| -- | None Available | ||
| $98,000 | Chicago Title Co |
Mortgage History
We collect this data history from publicly available records. To have your information removed, we recommend requesting removal directly through your county’s website.
| Date | Status | Borrower | Loan Amount |
|---|---|---|---|
| Open | $155,000 | ||
| Closed | $160,800 | ||
| Closed | $46,000 | ||
| Closed | $50,000 | ||
| Closed | $130,000 | ||
| Closed | $97,000 | ||
| Closed | $35,000 | ||
| Closed | $18,000 | ||
| Closed | $96,012 | ||
| Closed | $96,472 |
Tax History
We collect this data history from publicly available records. To have your information removed, we recommend requesting removal directly through your county’s website.
| Year | Tax Paid | Tax Assessment Tax Assessment Total Assessment is a certain percentage of the fair market value that is determined by local assessors to be the total taxable value of land and additions on the property. | Land | Improvement |
|---|---|---|---|---|
| 2026 | $2,314 | $213,555 | $60,470 | $153,085 |
| 2025 | $2,314 | $209,369 | $59,285 | $150,084 |
| 2024 | $2,268 | $205,265 | $58,123 | $147,142 |
| 2023 | $2,197 | $201,241 | $56,984 | $144,257 |
| 2022 | $2,162 | $197,296 | $55,867 | $141,429 |
| 2021 | $2,169 | $193,428 | $54,772 | $138,656 |
| 2020 | $2,102 | $191,446 | $54,211 | $137,235 |
| 2019 | $2,040 | $187,694 | $53,149 | $134,545 |
| 2018 | $2,017 | $184,014 | $52,107 | $131,907 |
| 2017 | $1,979 | $180,407 | $51,086 | $129,321 |
| 2016 | $1,913 | $176,871 | $50,085 | $126,786 |
| 2015 | $1,857 | $174,215 | $49,333 | $124,882 |
| 2014 | $1,786 | $170,803 | $48,367 | $122,436 |
Map
- 615 Vine St Unit 26
- 503 505 N Nevada St
- 722 &718 N Freeman St
- 429 Garfield St
- 1109 Hibiscus Way
- 1115 Sea Glass Way
- 415 S Weitzel St
- 425 S Horne St
- 403 S Horne St
- 427 S Clementine St
- 0 Clementine St Unit 5
- 2016 Winchester St
- 2202 Greenbrier Dr
- 525 S Freeman St
- 369 Alpine Ln
- 221 S Nevada St
- 123 S Nevada St
- 1009 S Coast Hwy
- 901 S Tremont St
- 1432 Buena St
Ask me questions while you tour the home.