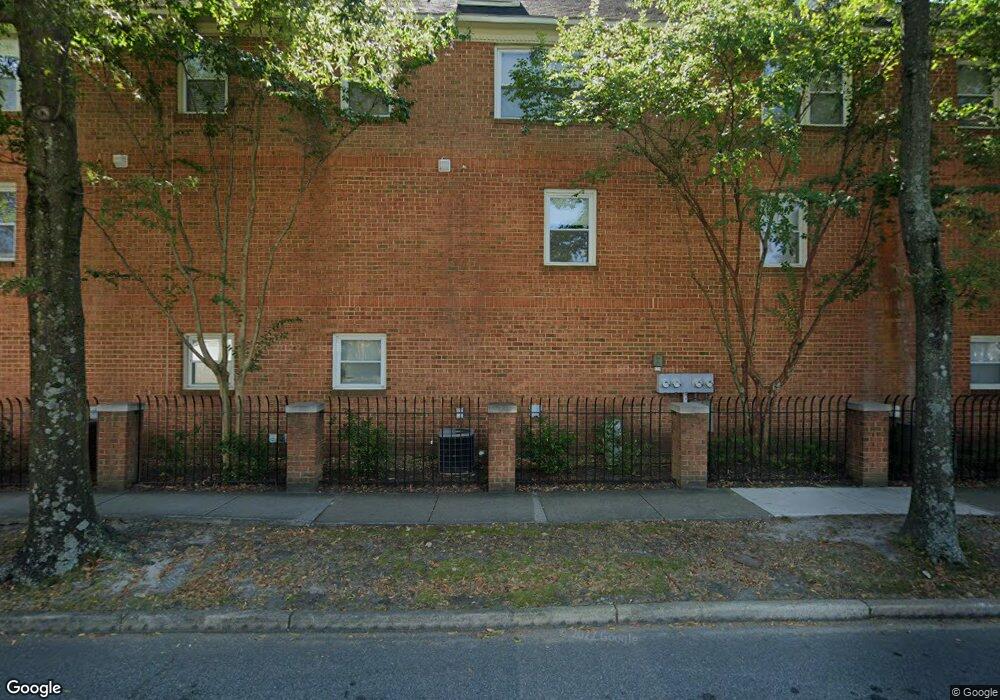
519 W 20th St Unit 307 Norfolk, VA 23517
Ghent NeighborhoodEstimated Value: $283,000 - $303,422
2
Beds
3
Baths
1,100
Sq Ft
$268/Sq Ft
Est. Value
About This Home
This home is located at 519 W 20th St Unit 307, Norfolk, VA 23517 and is currently estimated at $294,606, approximately $267 per square foot. 519 W 20th St Unit 307 is a home located in Norfolk City with nearby schools including W.H. Taylor Elementary School, Blair Middle School, and Maury High School.
Ownership History
Date
Name
Owned For
Owner Type
Purchase Details
Closed on
Jun 8, 2022
Sold by
Sarada Rao Appajosula
Bought by
Reinstein Stephen C
Current Estimated Value
Purchase Details
Closed on
Jul 5, 2017
Sold by
Baker Brendan S and Baker Whitney L
Bought by
Rao Appajosula Sarada
Home Financials for this Owner
Home Financials are based on the most recent Mortgage that was taken out on this home.
Original Mortgage
$215,000
Interest Rate
3.94%
Mortgage Type
Adjustable Rate Mortgage/ARM
Purchase Details
Closed on
May 8, 2014
Sold by
Doyle Kelsey E and Doyle Taylor P
Bought by
Baker Brendan S and Cox Whitney L
Home Financials for this Owner
Home Financials are based on the most recent Mortgage that was taken out on this home.
Original Mortgage
$199,405
Interest Rate
4.41%
Mortgage Type
New Conventional
Purchase Details
Closed on
Aug 1, 2011
Sold by
Gorbea Joseph J
Bought by
Cullinan Kelsey E and Doyle Taylor P
Create a Home Valuation Report for This Property
The Home Valuation Report is an in-depth analysis detailing your home's value as well as a comparison with similar homes in the area
Home Values in the Area
Average Home Value in this Area
Purchase History
| Date | Buyer | Sale Price | Title Company |
|---|---|---|---|
| Reinstein Stephen C | $275,000 | Old Republic Title | |
| Rao Appajosula Sarada | $215,000 | Attorney | |
| Baker Brendan S | $209,900 | Attorney | |
| Cullinan Kelsey E | $194,400 | None Available |
Source: Public Records
Mortgage History
| Date | Status | Borrower | Loan Amount |
|---|---|---|---|
| Previous Owner | Rao Appajosula Sarada | $215,000 | |
| Previous Owner | Baker Brendan S | $199,405 | |
| Closed | Reinstein Stephen C | $0 |
Source: Public Records
Tax History Compared to Growth
Tax History
| Year | Tax Paid | Tax Assessment Tax Assessment Total Assessment is a certain percentage of the fair market value that is determined by local assessors to be the total taxable value of land and additions on the property. | Land | Improvement |
|---|---|---|---|---|
| 2025 | $3,894 | $311,500 | $24,500 | $287,000 |
| 2024 | $3,598 | $292,500 | $24,500 | $268,000 |
| 2023 | $3,259 | $250,000 | $24,500 | $225,500 |
| 2022 | $3,046 | $243,700 | $24,500 | $219,200 |
| 2021 | $2,719 | $217,500 | $24,500 | $193,000 |
| 2020 | $2,683 | $214,600 | $23,500 | $191,100 |
| 2019 | $2,683 | $214,600 | $23,500 | $191,100 |
| 2018 | $2,716 | $217,300 | $23,500 | $193,800 |
| 2017 | $2,458 | $213,700 | $23,500 | $190,200 |
| 2016 | $2,458 | $192,600 | $22,900 | $169,700 |
| 2015 | $2,223 | $192,600 | $22,900 | $169,700 |
| 2014 | $2,223 | $192,600 | $22,900 | $169,700 |
Source: Public Records
Map
Nearby Homes
- 527 W 20th St Unit 404
- 538 Washington Park Unit B3
- 1915 Colonial Ave Unit 3
- 705 Spotswood Ave Unit A-6
- 1506 Colonial Ave Unit 9
- 1409 Colonial Ave Unit A4
- 747 Shirley Ave
- 828 Harrington Ave Unit 1
- 825 Spotswood Ave
- 1210 Stockley Gardens Unit 604
- 2406 Colley Ave
- 1302 Debree Ave
- 731 W Princess Anne Rd
- 800 W Princess Anne Rd Unit C6
- 913 Spotswood Ave Unit 1
- 810 W Princess Anne Rd Unit 303
- 810 W Princess Anne Rd Unit 401
- 437 W 27th St
- 1213 Botetourt Gardens
- 1610 Hampton Blvd
- 519 W 20th St Unit 301
- 519 W 20th St Unit 303
- 519 W 20th St Unit 302
- 519 W 20th St Unit 310
- 519 W 20th St Unit 309
- 519 W 20th St Unit 308
- 519 W 20th St Unit 306
- 519 W 20th St Unit 305
- 519 W 20th St Unit 304
- 519 W 20th St
- 543 W 20th St Unit 102
- 543 W 20th St Unit 105
- 543 W 20th St Unit 104
- 543 W 20th St Unit 103
- 543 W 20th St Unit 101
- 543 W 20th St
- 527 W 20th St Unit 405
- 527 W 20th St Unit 401
- 527 W 20th St Unit 407
- 527 W 20th St Unit 406