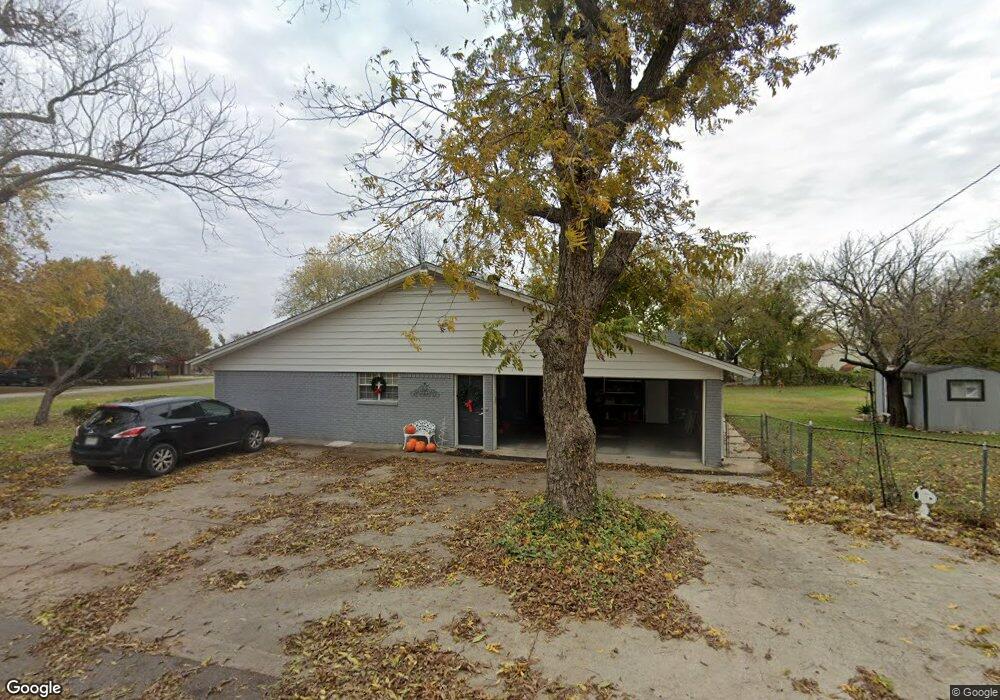
519 W 7th St Justin, TX 76247
Estimated Value: $431,484 - $472,000
3
Beds
2
Baths
2,587
Sq Ft
$173/Sq Ft
Est. Value
About This Home
This home is located at 519 W 7th St, Justin, TX 76247 and is currently estimated at $447,621, approximately $173 per square foot. 519 W 7th St is a home located in Denton County with nearby schools including Justin Elementary School, Gene Pike Middle School, and Northwest High School.
Ownership History
Date
Name
Owned For
Owner Type
Purchase Details
Closed on
Jun 28, 2018
Sold by
Hurley Joseph H and Hurley Selina M
Bought by
Finley Wanda
Current Estimated Value
Home Financials for this Owner
Home Financials are based on the most recent Mortgage that was taken out on this home.
Original Mortgage
$212,400
Outstanding Balance
$184,076
Interest Rate
4.5%
Mortgage Type
Stand Alone First
Estimated Equity
$263,545
Purchase Details
Closed on
Jun 26, 2018
Sold by
Finley Wanda B
Bought by
Jurley Joseph H and Hurley Selina M
Home Financials for this Owner
Home Financials are based on the most recent Mortgage that was taken out on this home.
Original Mortgage
$212,400
Outstanding Balance
$184,076
Interest Rate
4.5%
Mortgage Type
Stand Alone First
Estimated Equity
$263,545
Purchase Details
Closed on
Dec 17, 2007
Sold by
Copp Sandra
Bought by
Hurley Joseph H and Hurley Selina M
Purchase Details
Closed on
Aug 5, 2003
Sold by
Copp Sandra
Bought by
Hurley Joseph H and Hurley Selina M
Home Financials for this Owner
Home Financials are based on the most recent Mortgage that was taken out on this home.
Original Mortgage
$120,000
Interest Rate
5.24%
Mortgage Type
Purchase Money Mortgage
Create a Home Valuation Report for This Property
The Home Valuation Report is an in-depth analysis detailing your home's value as well as a comparison with similar homes in the area
Home Values in the Area
Average Home Value in this Area
Purchase History
| Date | Buyer | Sale Price | Title Company |
|---|---|---|---|
| Finley Wanda | -- | Republic Title Of Texas Inc | |
| Jurley Joseph H | -- | None Available | |
| Hurley Joseph H | -- | None Available | |
| Hurley Joseph H | -- | -- |
Source: Public Records
Mortgage History
| Date | Status | Borrower | Loan Amount |
|---|---|---|---|
| Open | Finley Wanda | $212,400 | |
| Closed | Jurley Joseph H | $212,400 | |
| Previous Owner | Hurley Joseph H | $120,000 |
Source: Public Records
Tax History Compared to Growth
Tax History
| Year | Tax Paid | Tax Assessment Tax Assessment Total Assessment is a certain percentage of the fair market value that is determined by local assessors to be the total taxable value of land and additions on the property. | Land | Improvement |
|---|---|---|---|---|
| 2025 | $6,702 | $365,000 | $141,606 | $223,394 |
| 2024 | $7,829 | $410,803 | $0 | $0 |
| 2023 | $6,261 | $385,751 | $131,219 | $297,781 |
| 2022 | $7,600 | $358,000 | $88,504 | $269,496 |
| 2021 | $7,609 | $325,000 | $56,642 | $268,358 |
| 2020 | $10,214 | $445,000 | $56,643 | $388,357 |
| 2019 | $5,441 | $230,000 | $55,368 | $174,632 |
| 2018 | $4,875 | $205,000 | $41,526 | $163,474 |
| 2017 | $4,829 | $204,536 | $44,987 | $159,549 |
| 2016 | $4,292 | $181,783 | $36,329 | $145,454 |
| 2015 | -- | $169,260 | $36,329 | $132,931 |
| 2013 | -- | $152,205 | $39,832 | $112,373 |
Source: Public Records
Map
Nearby Homes
- 603 N Denton Ave
- 402 W 6th St
- 418 W 4th St
- 315 W 6th St
- 414 W 4th St
- 416 W 3rd St
- 518 Leuty St
- 207 W 7th St
- 208 W 4th St
- 1009 W 7th St
- 217 Raveena Blvd
- 11575 Antrim Place
- 160 Sorrento Way
- 408 Creek Hill Way
- 1004 Canyon Dr
- 1014 Butterfly Ln
- 1006 Butterfly Ln
- 1004 Birkdale Dr
- 1016 Butterfly Ln
- 1060 Wheatland Dr