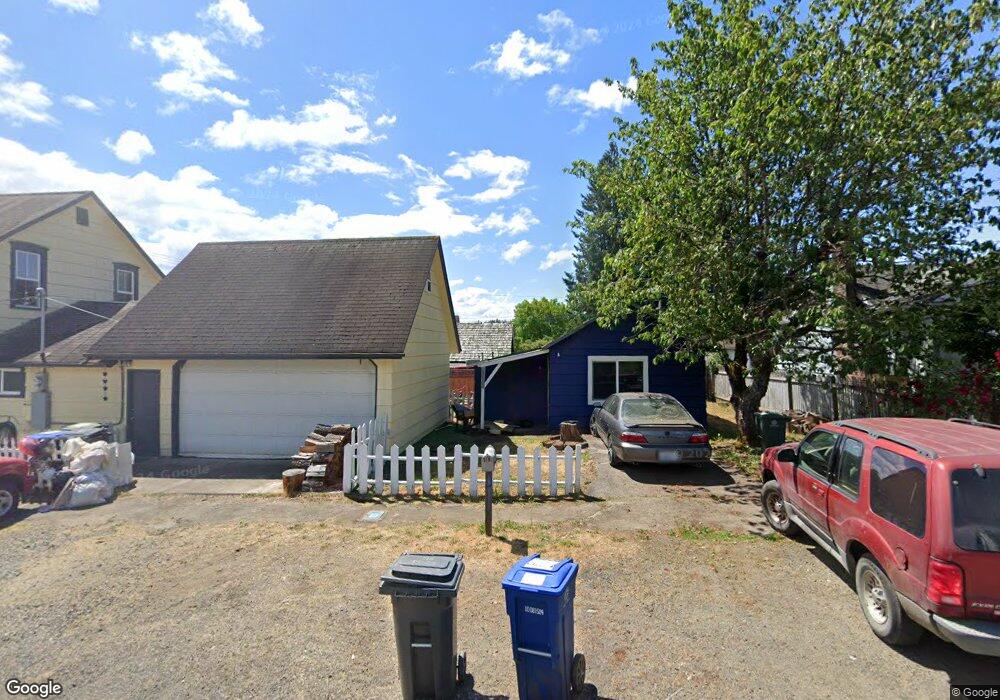
519 W Birch St Shelton, WA 98584
Estimated Value: $418,798 - $457,000
1
Bed
1
Bath
2,160
Sq Ft
$203/Sq Ft
Est. Value
About This Home
This home is located at 519 W Birch St, Shelton, WA 98584 and is currently estimated at $438,700, approximately $203 per square foot. 519 W Birch St is a home located in Mason County with nearby schools including Evergreen Elementary School, Olympic Middle School, and Oakland Bay Junior High School.
Ownership History
Date
Name
Owned For
Owner Type
Purchase Details
Closed on
Sep 7, 2022
Sold by
Baldwin Rachel K
Bought by
Fox Tangee R and Prim Orion J
Current Estimated Value
Home Financials for this Owner
Home Financials are based on the most recent Mortgage that was taken out on this home.
Original Mortgage
$436,500
Outstanding Balance
$416,620
Interest Rate
5.13%
Mortgage Type
New Conventional
Estimated Equity
$22,080
Purchase Details
Closed on
Jul 9, 2021
Sold by
Baldwin Jacque B
Bought by
Baldwin Rachel K
Purchase Details
Closed on
Aug 9, 2016
Sold by
Stevens Elita L
Bought by
Baldwin Rachel K and Baldwin Jacque
Home Financials for this Owner
Home Financials are based on the most recent Mortgage that was taken out on this home.
Original Mortgage
$6,126
Interest Rate
3.41%
Mortgage Type
Stand Alone Second
Create a Home Valuation Report for This Property
The Home Valuation Report is an in-depth analysis detailing your home's value as well as a comparison with similar homes in the area
Home Values in the Area
Average Home Value in this Area
Purchase History
| Date | Buyer | Sale Price | Title Company |
|---|---|---|---|
| Fox Tangee R | -- | Land Title | |
| Baldwin Rachel K | $173,550 | Olympic Title Company | |
| Baldwin Rachel K | $173,550 | Olympic Title Company | |
| Baldwin Rachel K | $156,000 | Olympic Title Company |
Source: Public Records
Mortgage History
| Date | Status | Borrower | Loan Amount |
|---|---|---|---|
| Open | Fox Tangee R | $436,500 | |
| Previous Owner | Baldwin Rachel K | $6,126 | |
| Previous Owner | Baldwin Rachel K | $153,174 |
Source: Public Records
Tax History Compared to Growth
Tax History
| Year | Tax Paid | Tax Assessment Tax Assessment Total Assessment is a certain percentage of the fair market value that is determined by local assessors to be the total taxable value of land and additions on the property. | Land | Improvement |
|---|---|---|---|---|
| 2025 | $3,833 | $393,885 | $31,410 | $362,475 |
| 2023 | $3,833 | $336,990 | $26,440 | $310,550 |
| 2022 | $3,411 | $272,790 | $24,940 | $247,850 |
| 2021 | $3,256 | $272,790 | $24,940 | $247,850 |
| 2020 | $3,044 | $240,150 | $27,110 | $213,040 |
| 2018 | $2,114 | $126,550 | $42,500 | $84,050 |
| 2017 | $1,781 | $126,550 | $42,500 | $84,050 |
| 2016 | $396 | $115,295 | $42,500 | $72,795 |
| 2015 | $392 | $115,295 | $42,500 | $72,795 |
| 2014 | -- | $112,045 | $40,000 | $72,045 |
| 2013 | -- | $165,825 | $37,500 | $128,325 |
Source: Public Records
Map
Nearby Homes
- 519 N 5th St
- 407 N 6th St
- 0 XXX Henry St
- 416 N 8th St
- 522 N 3rd St
- 201 W Alder St
- 127 W Alder St
- 722 718 W Franklin St
- 201 Moore Ave
- 903 W Franklin St
- 0 Hazel 001 St
- 411 W Grove St Unit B
- 1119 W Franklin St
- 218 S 2nd St
- 226 S 9th St
- 1233 W Birch St
- 1226 W Alder St
- 121 S 10th St
- 1212 W Railroad Ave
- 332 S 3rd St