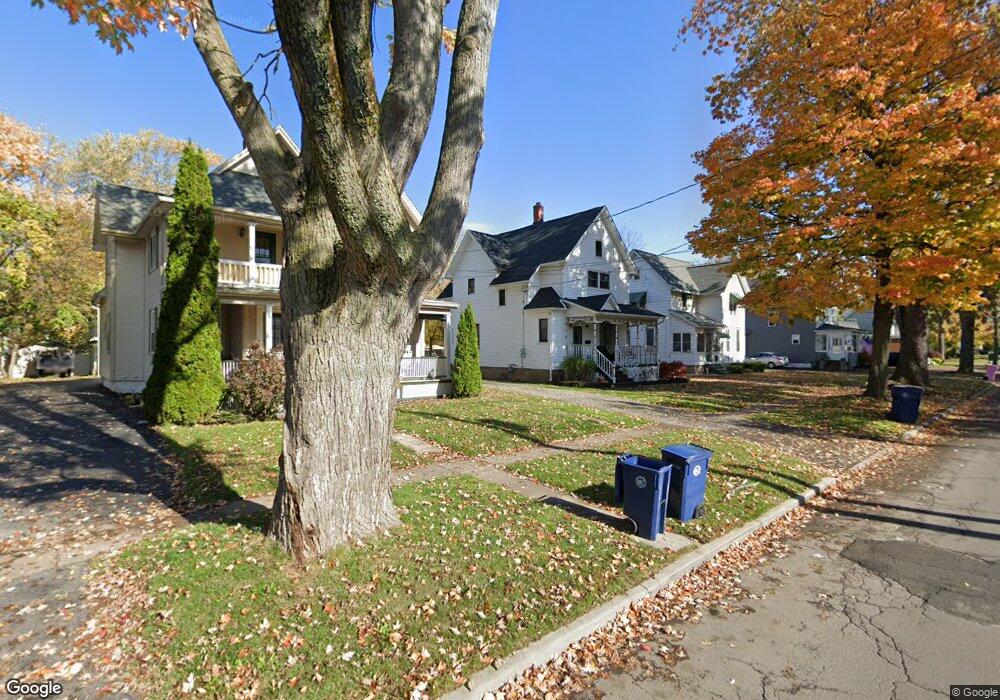
519 Walnut St Lockport, NY 14094
Estimated Value: $182,000 - $196,000
3
Beds
2
Baths
1,594
Sq Ft
$119/Sq Ft
Est. Value
About This Home
This home is located at 519 Walnut St, Lockport, NY 14094 and is currently estimated at $190,044, approximately $119 per square foot. 519 Walnut St is a home located in Niagara County with nearby schools including Aaron Mossell Junior High School, Lockport High School, and DeSales Catholic School.
Ownership History
Date
Name
Owned For
Owner Type
Purchase Details
Closed on
May 12, 2023
Sold by
Delgrosso Mark D
Bought by
Ferguson John
Current Estimated Value
Home Financials for this Owner
Home Financials are based on the most recent Mortgage that was taken out on this home.
Original Mortgage
$128,000
Outstanding Balance
$64,816
Interest Rate
6.39%
Mortgage Type
Seller Take Back
Estimated Equity
$125,228
Purchase Details
Closed on
Feb 4, 2011
Sold by
Barash Gregg M and Barash Sunny M
Bought by
Delgrosso Mark D and Delgrosso Carolgene
Home Financials for this Owner
Home Financials are based on the most recent Mortgage that was taken out on this home.
Original Mortgage
$124,400
Interest Rate
4.75%
Mortgage Type
Purchase Money Mortgage
Purchase Details
Closed on
Sep 14, 2001
Sold by
Delgrosso Mark D
Bought by
Delgrosso Mark
Create a Home Valuation Report for This Property
The Home Valuation Report is an in-depth analysis detailing your home's value as well as a comparison with similar homes in the area
Home Values in the Area
Average Home Value in this Area
Purchase History
| Date | Buyer | Sale Price | Title Company |
|---|---|---|---|
| Ferguson John | $135,000 | None Listed On Document | |
| Delgrosso Mark D | $165,000 | None Available | |
| Delgrosso Mark | -- | -- |
Source: Public Records
Mortgage History
| Date | Status | Borrower | Loan Amount |
|---|---|---|---|
| Open | Ferguson John | $128,000 | |
| Previous Owner | Delgrosso Mark D | $124,400 |
Source: Public Records
Tax History
| Year | Tax Paid | Tax Assessment Tax Assessment Total Assessment is a certain percentage of the fair market value that is determined by local assessors to be the total taxable value of land and additions on the property. | Land | Improvement |
|---|---|---|---|---|
| 2024 | $3,669 | $135,000 | $5,400 | $129,600 |
| 2023 | $3,691 | $132,000 | $5,400 | $126,600 |
| 2022 | $2,807 | $120,000 | $5,400 | $114,600 |
| 2021 | $2,543 | $64,500 | $6,900 | $57,600 |
| 2020 | $2,489 | $64,500 | $6,900 | $57,600 |
| 2019 | $558 | $64,500 | $6,900 | $57,600 |
| 2018 | $1,799 | $64,500 | $6,900 | $57,600 |
| 2017 | $1,793 | $64,500 | $6,900 | $57,600 |
| 2016 | $1,685 | $62,600 | $6,900 | $55,700 |
| 2015 | -- | $62,600 | $6,900 | $55,700 |
| 2014 | -- | $62,600 | $6,900 | $55,700 |
Source: Public Records
Map
Nearby Homes
Your Personal Tour Guide
Ask me questions while you tour the home.