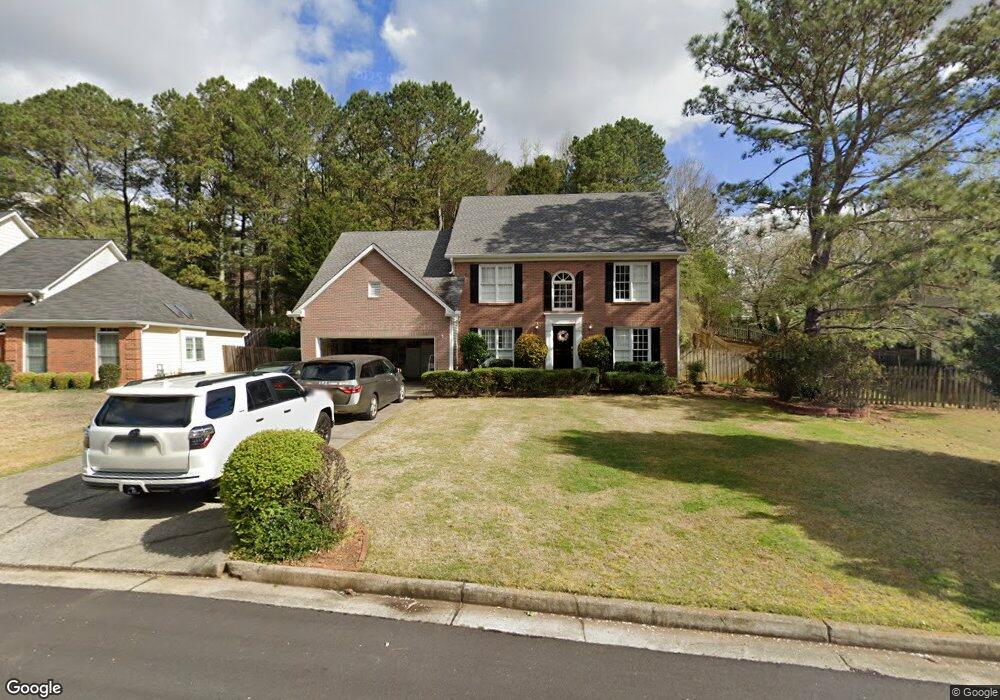
5190 Courton St Alpharetta, GA 30022
Estimated Value: $536,373 - $565,000
4
Beds
3
Baths
2,055
Sq Ft
$269/Sq Ft
Est. Value
About This Home
This home is located at 5190 Courton St, Alpharetta, GA 30022 and is currently estimated at $552,843, approximately $269 per square foot. 5190 Courton St is a home located in Fulton County with nearby schools including Abbotts Hill Elementary School, Taylor Road Middle School, and Chattahoochee High School.
Ownership History
Date
Name
Owned For
Owner Type
Purchase Details
Closed on
Sep 4, 2012
Sold by
Hong Jeong Il
Bought by
Hong Jeong Il and Hong Kum
Current Estimated Value
Home Financials for this Owner
Home Financials are based on the most recent Mortgage that was taken out on this home.
Original Mortgage
$238,700
Outstanding Balance
$162,657
Interest Rate
3.25%
Mortgage Type
FHA
Estimated Equity
$390,186
Purchase Details
Closed on
Sep 8, 2008
Sold by
Tremblay Gilles D and Tremblay Dianne L
Bought by
Hong Jeong I
Home Financials for this Owner
Home Financials are based on the most recent Mortgage that was taken out on this home.
Original Mortgage
$238,500
Interest Rate
6.48%
Mortgage Type
New Conventional
Purchase Details
Closed on
Aug 12, 2002
Sold by
Tremblay Gilles D
Bought by
Tremblay Gilles D and Tremblay Dianne L
Home Financials for this Owner
Home Financials are based on the most recent Mortgage that was taken out on this home.
Original Mortgage
$231,700
Interest Rate
5.5%
Mortgage Type
New Conventional
Create a Home Valuation Report for This Property
The Home Valuation Report is an in-depth analysis detailing your home's value as well as a comparison with similar homes in the area
Home Values in the Area
Average Home Value in this Area
Purchase History
| Date | Buyer | Sale Price | Title Company |
|---|---|---|---|
| Hong Jeong Il | -- | -- | |
| Hong Jeong I | $265,000 | -- | |
| Tremblay Gilles D | -- | -- | |
| Tremblay Gilles D | $243,900 | -- |
Source: Public Records
Mortgage History
| Date | Status | Borrower | Loan Amount |
|---|---|---|---|
| Open | Hong Jeong Il | $238,700 | |
| Previous Owner | Hong Jeong I | $238,500 | |
| Previous Owner | Tremblay Gilles D | $231,700 |
Source: Public Records
Tax History Compared to Growth
Tax History
| Year | Tax Paid | Tax Assessment Tax Assessment Total Assessment is a certain percentage of the fair market value that is determined by local assessors to be the total taxable value of land and additions on the property. | Land | Improvement |
|---|---|---|---|---|
| 2025 | $3,609 | $214,080 | $43,840 | $170,240 |
| 2023 | $4,149 | $147,000 | $37,840 | $109,160 |
| 2022 | $3,462 | $138,720 | $35,480 | $103,240 |
| 2021 | $3,916 | $124,280 | $27,400 | $96,880 |
| 2020 | $3,869 | $120,200 | $26,680 | $93,520 |
| 2019 | $465 | $118,040 | $26,200 | $91,840 |
| 2018 | $3,438 | $105,560 | $27,880 | $77,680 |
| 2017 | $2,859 | $84,000 | $22,520 | $61,480 |
| 2016 | $2,818 | $84,000 | $22,520 | $61,480 |
| 2015 | $2,849 | $84,000 | $22,520 | $61,480 |
| 2014 | $2,962 | $84,000 | $22,520 | $61,480 |
Source: Public Records
Map
Nearby Homes
- 5160 Abbotts Bridge Rd
- 130 Douglas Fir Ct Unit 1
- 4965 N Bridges Dr
- 5060 Cinnabar Dr
- 11150 Highfield Chase Dr
- 6365 Murets Rd
- 11619 Davenport Ln
- 11686 Davenport Ln
- 4905 Weathervane Dr
- 485 Portrait Cir
- 4965 Cinnabar Dr
- 335 Dunhill Way Ct
- 5022 Anclote Dr
- 11125 Linbrook Ln
- 4790 Roswell Mill Dr
- 200 Boca Ciega Ct
- 690 Kimball Parc Way
- 680 Kimball Parc Way
- 5325 Hillgate Crossing
- 1660 Gladewood Dr
- 11360 Saint Patrice Way Unit II
- 5180 Courton St
- 5205 Courton St
- 5205 Saint Patrice Way
- 5170 Courton St
- 0 Saint Patrice Way Unit 7490305
- 0 Saint Patrice Way
- 11380 Saint Patrice Way
- 0 Courton St Unit 7156305
- 0 Courton St Unit 8038823
- 0 Courton St Unit 8221668
- 5195 Courton St
- 5195 Courton St Unit 5195
- 5105 Byers Rd
- 11330 Saint Patrice Way
- 5160 Courton St
- 5185 Courton St Unit 2
- 11390 Saint Patrice Way
- 11355 Saint Patrice Way