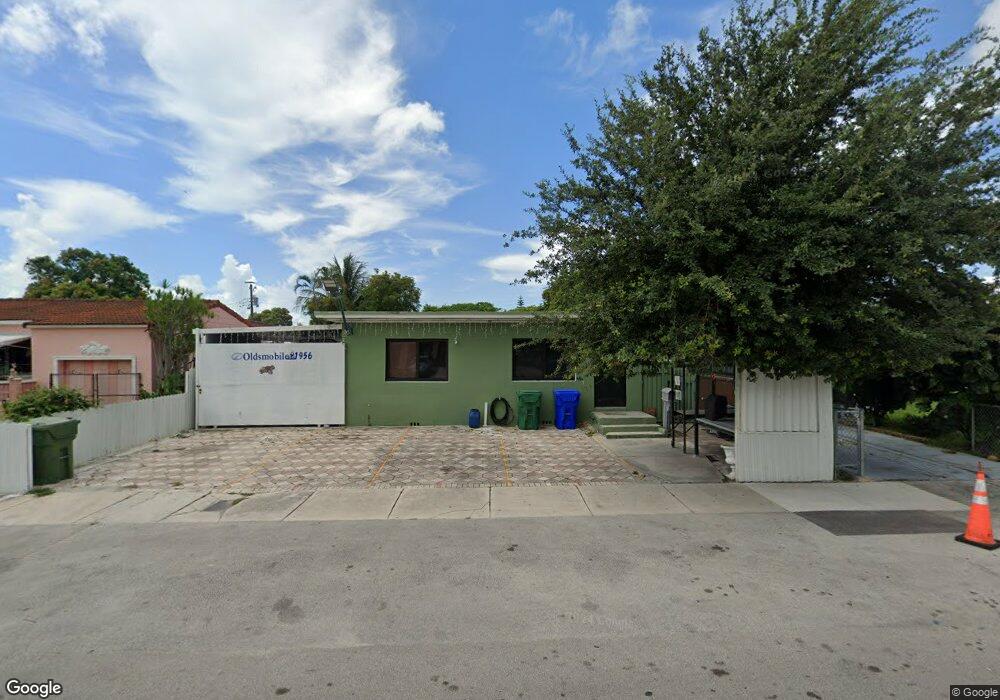
5190 NW 4th St Miami, FL 33126
Flagami NeighborhoodEstimated Value: $841,000 - $1,164,000
3
Beds
2
Baths
3,172
Sq Ft
$300/Sq Ft
Est. Value
About This Home
This home is located at 5190 NW 4th St, Miami, FL 33126 and is currently estimated at $950,420, approximately $299 per square foot. 5190 NW 4th St is a home located in Miami-Dade County with nearby schools including Henry M. Flagler Elementary School, Kinloch Park Middle School, and South Miami Senior High School.
Ownership History
Date
Name
Owned For
Owner Type
Purchase Details
Closed on
Nov 28, 2023
Sold by
Quintana Alberto and Flores Darlin Yesenia
Bought by
Quintana Alberto
Current Estimated Value
Purchase Details
Closed on
Oct 21, 2022
Sold by
Quintana Alberto
Bought by
Quintana Alberto
Purchase Details
Closed on
Aug 11, 2022
Sold by
Quintana Alberto and Flores Darlin Yesenia
Bought by
Quintana Alberto
Purchase Details
Closed on
Jan 9, 2004
Sold by
Quintana Jose E
Bought by
Quintana Jose E and Quintana Alberto
Home Financials for this Owner
Home Financials are based on the most recent Mortgage that was taken out on this home.
Original Mortgage
$140,700
Interest Rate
5.77%
Mortgage Type
New Conventional
Purchase Details
Closed on
Jan 12, 2001
Sold by
Angelis Angie and Angelis Kiki
Bought by
Quintana Jose E
Purchase Details
Closed on
Jan 19, 2000
Sold by
Angelis Photini J
Bought by
Angelis Photini J and Angelis Angie
Create a Home Valuation Report for This Property
The Home Valuation Report is an in-depth analysis detailing your home's value as well as a comparison with similar homes in the area
Home Values in the Area
Average Home Value in this Area
Purchase History
| Date | Buyer | Sale Price | Title Company |
|---|---|---|---|
| Quintana Alberto | -- | None Listed On Document | |
| Quintana Alberto | -- | None Listed On Document | |
| Quintana Alberto | -- | -- | |
| Quintana Alberto | -- | None Listed On Document | |
| Quintana Jose E | -- | -- | |
| Quintana Jose E | $115,000 | -- | |
| Angelis Photini J | $30,000 | -- |
Source: Public Records
Mortgage History
| Date | Status | Borrower | Loan Amount |
|---|---|---|---|
| Previous Owner | Angelis Photini J | $140,700 | |
| Previous Owner | Quintana Jose E | $140,700 |
Source: Public Records
Tax History Compared to Growth
Tax History
| Year | Tax Paid | Tax Assessment Tax Assessment Total Assessment is a certain percentage of the fair market value that is determined by local assessors to be the total taxable value of land and additions on the property. | Land | Improvement |
|---|---|---|---|---|
| 2025 | $12,872 | $693,669 | -- | -- |
| 2024 | $11,302 | $665,326 | $347,470 | $317,856 |
| 2023 | $11,302 | $508,957 | $0 | $0 |
| 2022 | $6,218 | $267,824 | $0 | $0 |
| 2021 | $5,553 | $243,477 | $160,053 | $83,424 |
| 2020 | $5,388 | $243,822 | $160,053 | $83,769 |
| 2019 | $4,904 | $216,288 | $132,173 | $84,115 |
| 2018 | $4,521 | $212,424 | $132,173 | $80,251 |
| 2017 | $4,231 | $173,366 | $0 | $0 |
| 2016 | $3,969 | $157,606 | $0 | $0 |
| 2015 | $3,720 | $143,279 | $0 | $0 |
| 2014 | $3,350 | $130,254 | $0 | $0 |
Source: Public Records
Map
Nearby Homes
- 5250 NW 4th St
- 5031 NW 4th St
- 480 NW 53rd Ave
- 5271 NW 1st St
- 5050 NW 7th St Unit 309
- 5050 NW 7th St Unit 720
- 5050 NW 7th St Unit 210
- 5050 NW 7th St Unit 312
- 5050 NW 7th St Unit PH16
- 5050 NW 7th St Unit 709
- 5249 NW 7th St Unit 103
- 5199 NW 7th St Unit 607
- 5201 NW 7th St Unit 507
- 5201 NW 7th St Unit 212
- 5201 NW 7th St Unit 106
- 5201 NW 7th St Unit 609W
- 5091 NW 7th St Unit 1001
- 5091 NW 7th St Unit 911
- 5091 NW 7th St Unit 711
- 5085 NW 7th St Unit 1101
- 5187 NW 4th St
- 385 NW 52nd Ave
- 5170 NW 4th St
- 5160 NW 4th St
- 5202 NW 4th St
- 5177 NW 4th St
- 5171 NW 2nd Terrace
- 5150 NW 4th St
- 5152 NW 4th St Unit 2
- 5152 NW 4th St Unit 1
- 5152 NW 4th St
- 5223 NW 4th St
- 382 NW 52nd Ave
- 5193 NW 2nd Terrace
- 403 NW 52nd Ave
- 270 NW 52nd Ave
- 5175 NW 4th St
- 5167 NW 2nd Terrace
- 403 NW 52nd Ave
- 5173 NW 4th St