Estimated Value: $234,000 - $346,000
3
Beds
3
Baths
1,440
Sq Ft
$192/Sq Ft
Est. Value
About This Home
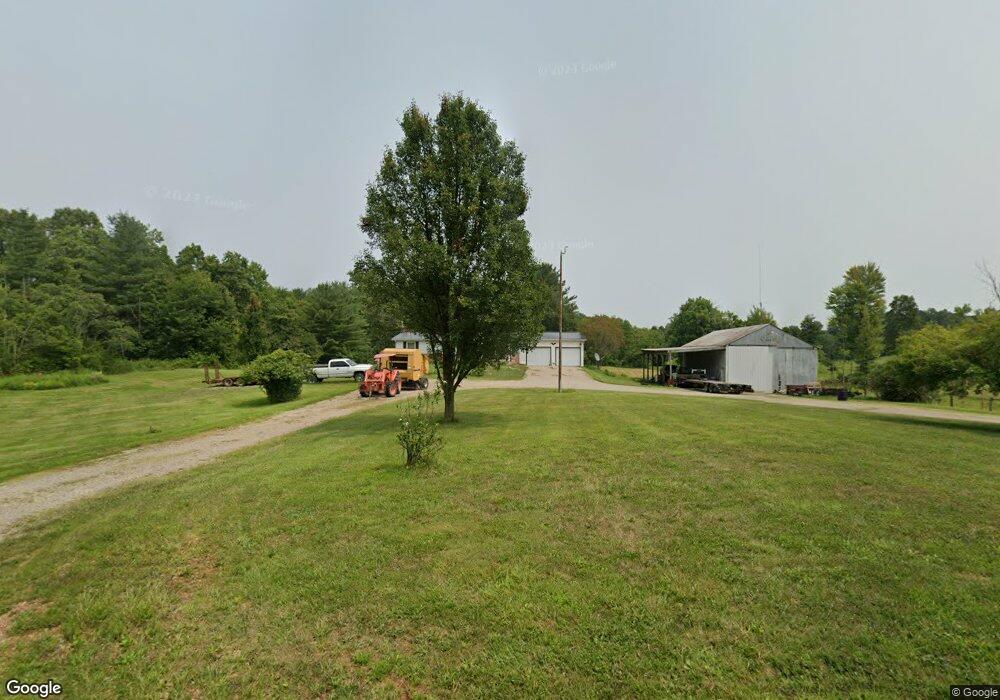
This home is located at 5190 Price Rd, Malta, OH 43758 and is currently estimated at $276,212, approximately $191 per square foot. 5190 Price Rd is a home located in Morgan County with nearby schools including Morgan High School.
Ownership History
Date
Name
Owned For
Owner Type
Purchase Details
Closed on
Mar 13, 2025
Sold by
Sigman Peter E and Snyder Angel M
Bought by
Parker Brooke E and Lawrence John B
Current Estimated Value
Home Financials for this Owner
Home Financials are based on the most recent Mortgage that was taken out on this home.
Original Mortgage
$258,236
Outstanding Balance
$256,919
Interest Rate
6.89%
Mortgage Type
FHA
Estimated Equity
$19,293
Purchase Details
Closed on
Mar 22, 2014
Sold by
Nelson Wanda and Nelson Randall D
Bought by
Sigman Peter E and Snyder Angel M
Home Financials for this Owner
Home Financials are based on the most recent Mortgage that was taken out on this home.
Original Mortgage
$89,000
Interest Rate
4.29%
Mortgage Type
Future Advance Clause Open End Mortgage
Purchase Details
Closed on
Dec 2, 2010
Sold by
Nelson Wanda
Bought by
Nelson Wanda and Nelson Randall D
Purchase Details
Closed on
Dec 4, 1997
Sold by
Nelson Wanda
Bought by
Nelson Wanda
Create a Home Valuation Report for This Property
The Home Valuation Report is an in-depth analysis detailing your home's value as well as a comparison with similar homes in the area
Home Values in the Area
Average Home Value in this Area
Purchase History
| Date | Buyer | Sale Price | Title Company |
|---|---|---|---|
| Parker Brooke E | $263,000 | Elite Land Title | |
| Sigman Peter E | $101,000 | None Available | |
| Nelson Wanda | -- | None Available | |
| Nelson Wanda | -- | -- |
Source: Public Records
Mortgage History
| Date | Status | Borrower | Loan Amount |
|---|---|---|---|
| Open | Parker Brooke E | $258,236 | |
| Previous Owner | Sigman Peter E | $89,000 |
Source: Public Records
Tax History Compared to Growth
Tax History
| Year | Tax Paid | Tax Assessment Tax Assessment Total Assessment is a certain percentage of the fair market value that is determined by local assessors to be the total taxable value of land and additions on the property. | Land | Improvement |
|---|---|---|---|---|
| 2024 | $1,577 | $50,330 | $7,720 | $42,610 |
| 2023 | $1,577 | $34,190 | $6,300 | $27,890 |
| 2022 | $1,056 | $34,190 | $6,300 | $27,890 |
| 2021 | $1,067 | $34,190 | $6,300 | $27,890 |
| 2019 | $1,019 | $31,260 | $5,720 | $25,540 |
| 2018 | $978 | $31,260 | $5,720 | $25,540 |
| 2017 | $987 | $30,892 | $4,918 | $25,974 |
| 2016 | $990 | $30,892 | $4,918 | $25,974 |
| 2015 | $990 | $30,892 | $4,918 | $25,974 |
| 2014 | $732 | $30,892 | $4,918 | $25,974 |
| 2013 | $718 | $30,892 | $4,918 | $25,974 |
Source: Public Records
Map
Nearby Homes
- 8960 State Route 37
- 10570 Timberman Rd
- 10270 W Triadelphia Rd
- 0 Morganville Rd Unit 5123894
- 0 Morganville Rd Unit 225017374
- 0 Township Road 202
- 14632 Township Road 202 NE
- 5975 Helaman Ln
- 690 Ames Rd
- 360 Glass Rd NW
- 8752 N Rokeby Dr NW
- 3630 Leisure Dr NW
- 0 Leisure Dr NW Unit Lot 2
- 0 Leisure Dr NW Unit Lot 4
- Lot #2 Leisure Dr
- 9371 Mautz Dr
- 14105 Portie-Flamingo Rd SE
- 1420 Tatmans Rd NE
- 13877 Portie Flamingo Rd SE
- 9911 N River Rd NW