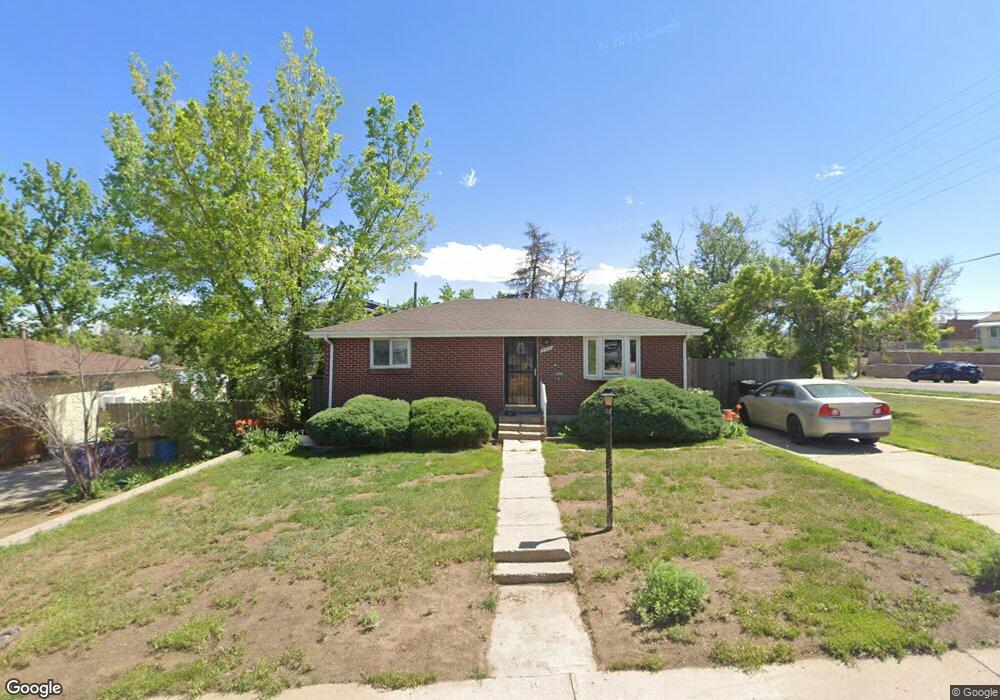
5190 W Bingham Place Denver, CO 80219
Westwood NeighborhoodEstimated Value: $379,317 - $427,000
2
Beds
2
Baths
966
Sq Ft
$408/Sq Ft
Est. Value
About This Home
This home is located at 5190 W Bingham Place, Denver, CO 80219 and is currently estimated at $394,579, approximately $408 per square foot. 5190 W Bingham Place is a home located in Denver County with nearby schools including Knapp Elementary School, Kepner Beacon Middle School, and West High School.
Ownership History
Date
Name
Owned For
Owner Type
Purchase Details
Closed on
Oct 21, 2016
Sold by
Kelley Mary M
Bought by
Kelley Anderle Mary M
Current Estimated Value
Home Financials for this Owner
Home Financials are based on the most recent Mortgage that was taken out on this home.
Original Mortgage
$394,500
Outstanding Balance
$320,699
Interest Rate
3.91%
Mortgage Type
Reverse Mortgage Home Equity Conversion Mortgage
Estimated Equity
$73,880
Purchase Details
Closed on
Nov 12, 2013
Sold by
Kelley Anderle Mary
Bought by
Anderle Mary M Kelley
Purchase Details
Closed on
Feb 3, 1999
Sold by
Kelley Mary M
Bought by
Kelley Mary M and Anderle Ron
Home Financials for this Owner
Home Financials are based on the most recent Mortgage that was taken out on this home.
Original Mortgage
$89,000
Interest Rate
6.85%
Create a Home Valuation Report for This Property
The Home Valuation Report is an in-depth analysis detailing your home's value as well as a comparison with similar homes in the area
Home Values in the Area
Average Home Value in this Area
Purchase History
| Date | Buyer | Sale Price | Title Company |
|---|---|---|---|
| Kelley Anderle Mary M | -- | Ct | |
| Anderle Mary M Kelley | -- | None Available | |
| Kelley Anderle Mary M | -- | None Available | |
| Kelley Mary M | -- | -- |
Source: Public Records
Mortgage History
| Date | Status | Borrower | Loan Amount |
|---|---|---|---|
| Open | Kelley Anderle Mary M | $394,500 | |
| Previous Owner | Kelley Mary M | $89,000 |
Source: Public Records
Tax History Compared to Growth
Tax History
| Year | Tax Paid | Tax Assessment Tax Assessment Total Assessment is a certain percentage of the fair market value that is determined by local assessors to be the total taxable value of land and additions on the property. | Land | Improvement |
|---|---|---|---|---|
| 2024 | $1,453 | $25,050 | $4,330 | $20,720 |
| 2023 | $1,422 | $25,050 | $4,330 | $20,720 |
| 2022 | $993 | $19,440 | $8,310 | $11,130 |
| 2021 | $993 | $20,000 | $8,550 | $11,450 |
| 2020 | $955 | $20,020 | $5,560 | $14,460 |
| 2019 | $928 | $20,020 | $5,560 | $14,460 |
| 2018 | $820 | $17,800 | $5,170 | $12,630 |
| 2017 | $818 | $17,800 | $5,170 | $12,630 |
| 2016 | $528 | $12,930 | $5,715 | $7,215 |
| 2015 | $1,010 | $12,930 | $5,715 | $7,215 |
| 2014 | $843 | $10,150 | $2,380 | $7,770 |
Source: Public Records
Map
Nearby Homes
- 560 S Ames St
- 5105 W Virginia Ave
- 433 S Xavier St
- 381 S Ames St Unit 204
- 381 S Ames St Unit F103
- 381 S Ames St Unit A206
- 381 S Ames St Unit C-203
- 381 S Ames St Unit B103
- 5110 W Ohio Ave
- 754 S Depew St
- 4670 W Nevada Place Unit A
- 4501 W Alaska Place Unit B
- 4582 W Alameda Ave
- 4580 W Alameda Ave
- 739 S Utica St
- 4400 W Alameda Ave
- 191 S Windsor Dr
- 671 S Stuart St
- 4332 W Nevada Place
- 5711 W Kentucky Ave
- 5160 W Bingham Place
- 560 S Sheridan Blvd
- 5140 W Bingham Place
- 5195 W Bingham Place
- 5175 W Bingham Place
- 5155 W Bingham Place
- 580 S Sheridan Blvd
- 5120 W Bingham Place
- 5135 W Bingham Place
- 561 S Sheridan Blvd
- 551 S Sheridan Blvd
- 5100 W Bingham Place
- 571 S Sheridan Blvd
- 5125 W Bingham Place
- 5115 W Custer Place
- 5269-5297 W Center Ave
- 541 S Sheridan Blvd
- 5185 W Custer Place
- 5279 W Center Ave Unit 203
- 5277 W Center Ave Unit APPROX