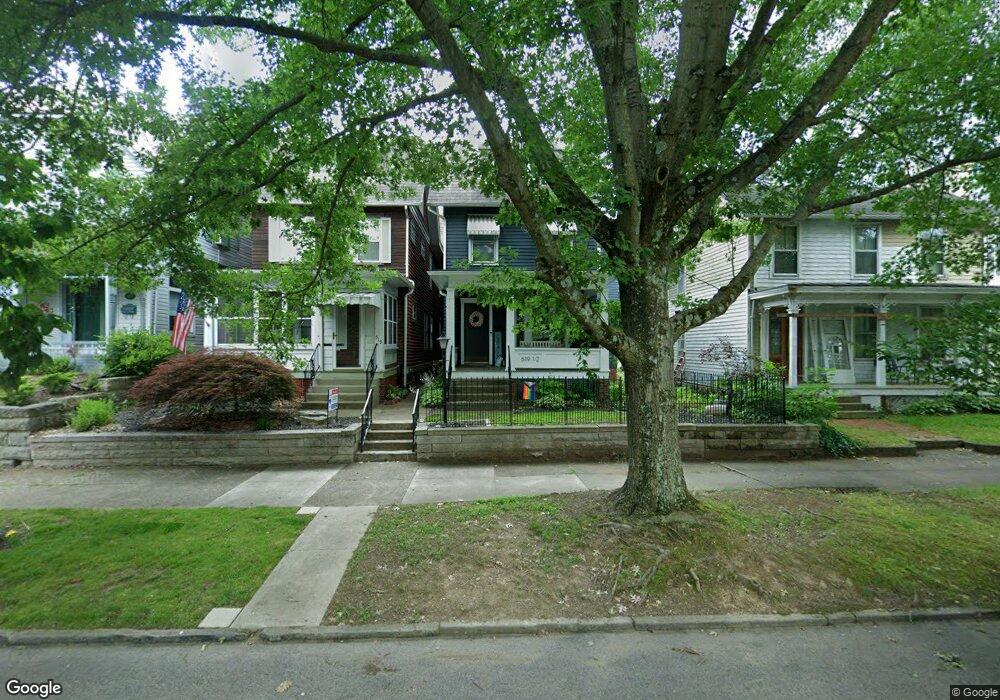
5191/2 Fourth St Marietta, OH 45750
Estimated Value: $244,000 - $311,000
4
Beds
3
Baths
2,480
Sq Ft
$113/Sq Ft
Est. Value
About This Home
This home is located at 5191/2 Fourth St, Marietta, OH 45750 and is currently estimated at $279,724, approximately $112 per square foot. 5191/2 Fourth St is a home located in Washington County with nearby schools including Marietta High School, St. Mary Catholic School, and Wood County Christian School.
Ownership History
Date
Name
Owned For
Owner Type
Purchase Details
Closed on
Oct 25, 2021
Sold by
Heran Jacquelyn
Bought by
Price Devon P
Current Estimated Value
Home Financials for this Owner
Home Financials are based on the most recent Mortgage that was taken out on this home.
Original Mortgage
$187,200
Outstanding Balance
$171,273
Interest Rate
2.88%
Mortgage Type
New Conventional
Estimated Equity
$108,451
Purchase Details
Closed on
Feb 9, 2018
Sold by
Berry Susan P
Bought by
Heran Jacquelyn
Purchase Details
Closed on
Mar 21, 2013
Sold by
Ayers Phyllis B
Bought by
Berry Susan P
Home Financials for this Owner
Home Financials are based on the most recent Mortgage that was taken out on this home.
Original Mortgage
$67,500
Interest Rate
3.5%
Mortgage Type
Adjustable Rate Mortgage/ARM
Purchase Details
Closed on
Jun 12, 1992
Bought by
Buckley Howard A
Purchase Details
Closed on
Nov 29, 1989
Create a Home Valuation Report for This Property
The Home Valuation Report is an in-depth analysis detailing your home's value as well as a comparison with similar homes in the area
Home Values in the Area
Average Home Value in this Area
Purchase History
| Date | Buyer | Sale Price | Title Company |
|---|---|---|---|
| Price Devon P | $208,000 | Title First Agency Inc | |
| Heran Jacquelyn | $139,000 | Title First | |
| Berry Susan P | $90,000 | None Available | |
| Buckley Howard A | $65,000 | -- | |
| -- | -- | -- |
Source: Public Records
Mortgage History
| Date | Status | Borrower | Loan Amount |
|---|---|---|---|
| Open | Price Devon P | $187,200 | |
| Previous Owner | Berry Susan P | $67,500 |
Source: Public Records
Tax History Compared to Growth
Tax History
| Year | Tax Paid | Tax Assessment Tax Assessment Total Assessment is a certain percentage of the fair market value that is determined by local assessors to be the total taxable value of land and additions on the property. | Land | Improvement |
|---|---|---|---|---|
| 2024 | $2,735 | $82,920 | $6,310 | $76,610 |
| 2023 | $2,735 | $82,920 | $6,310 | $76,610 |
| 2022 | $2,713 | $82,920 | $6,310 | $76,610 |
| 2021 | $1,836 | $53,150 | $4,780 | $48,370 |
| 2020 | $1,846 | $53,150 | $4,780 | $48,370 |
| 2019 | $1,842 | $53,150 | $4,780 | $48,370 |
| 2018 | $1,781 | $48,590 | $3,990 | $44,600 |
| 2017 | $1,777 | $48,590 | $3,990 | $44,600 |
| 2016 | $3,118 | $48,590 | $3,990 | $44,600 |
| 2015 | $1,734 | $45,310 | $4,520 | $40,790 |
| 2014 | $2,912 | $45,310 | $4,520 | $40,790 |
| 2013 | $1,686 | $45,310 | $4,520 | $40,790 |
Source: Public Records
Map
Nearby Homes
- 4th and Church St
- 316 5th St
- 505 Charles St
- 211 Meigs St
- 329 N 7th St
- 308 Gross Ave and Clifton St
- 0 Charles St Unit 225028714
- 0 Charles St Unit 5144598
- 412 6th St
- 503 3rd St
- 779 Buckeye Ave
- 316 Harmar St
- 400 Maple St
- 0 Shade St
- 412 Lord St
- 210 Phillips St
- 417 Maple St
- 608 2nd St
- 117 Franklin St
- 619 3rd St