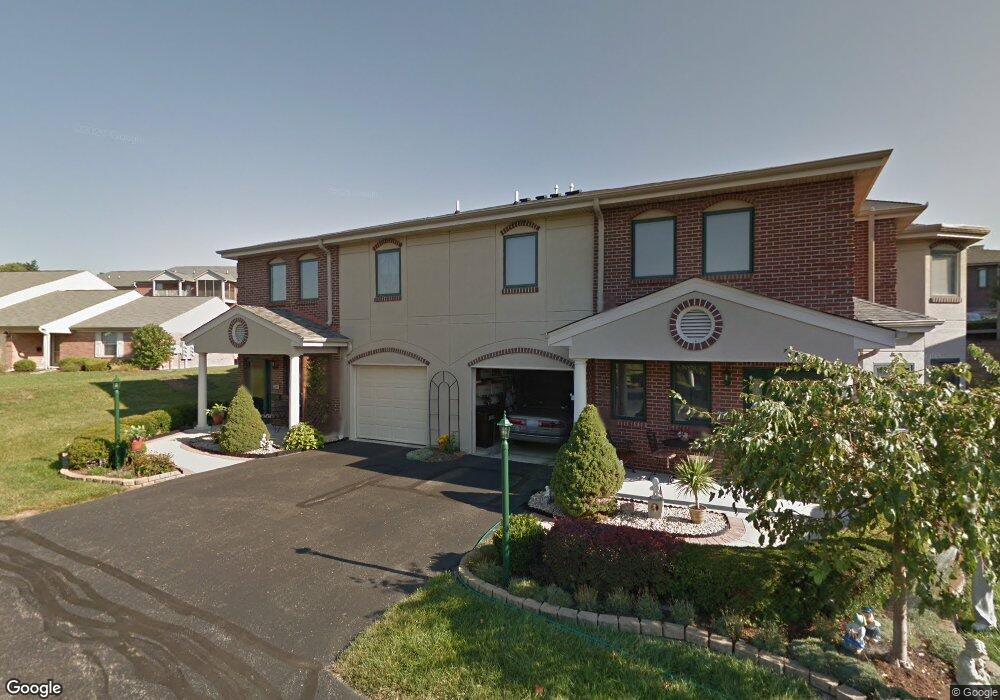
5191 Northbend Crossing Unit 94 Cincinnati, OH 45247
West Monfort Heights NeighborhoodEstimated Value: $202,191 - $217,000
2
Beds
2
Baths
1,252
Sq Ft
$170/Sq Ft
Est. Value
About This Home
This home is located at 5191 Northbend Crossing Unit 94, Cincinnati, OH 45247 and is currently estimated at $212,298, approximately $169 per square foot. 5191 Northbend Crossing Unit 94 is a home located in Hamilton County with nearby schools including Monfort Heights Elementary School, White Oak Middle School, and Colerain High School.
Ownership History
Date
Name
Owned For
Owner Type
Purchase Details
Closed on
Aug 20, 2019
Sold by
Marois Marie
Bought by
Tognozzi Elizabeth L and Tognozzi Albert R
Current Estimated Value
Purchase Details
Closed on
Aug 28, 2012
Sold by
Kates Linda M
Bought by
Harris Robert A and Harris Betty J
Home Financials for this Owner
Home Financials are based on the most recent Mortgage that was taken out on this home.
Original Mortgage
$57,500
Interest Rate
3.52%
Mortgage Type
New Conventional
Purchase Details
Closed on
Jan 17, 2003
Sold by
S/Nbl Associates
Bought by
Kates Mearle and Kates Linda M
Home Financials for this Owner
Home Financials are based on the most recent Mortgage that was taken out on this home.
Original Mortgage
$90,000
Interest Rate
6.01%
Mortgage Type
Unknown
Create a Home Valuation Report for This Property
The Home Valuation Report is an in-depth analysis detailing your home's value as well as a comparison with similar homes in the area
Home Values in the Area
Average Home Value in this Area
Purchase History
| Date | Buyer | Sale Price | Title Company |
|---|---|---|---|
| Tognozzi Elizabeth L | $135,000 | Northwest Ttl Fam Of Compani | |
| Harris Robert A | -- | None Available | |
| Kates Mearle | $140,600 | -- |
Source: Public Records
Mortgage History
| Date | Status | Borrower | Loan Amount |
|---|---|---|---|
| Previous Owner | Harris Robert A | $57,500 | |
| Previous Owner | Kates Mearle | $90,000 |
Source: Public Records
Tax History Compared to Growth
Tax History
| Year | Tax Paid | Tax Assessment Tax Assessment Total Assessment is a certain percentage of the fair market value that is determined by local assessors to be the total taxable value of land and additions on the property. | Land | Improvement |
|---|---|---|---|---|
| 2024 | $2,612 | $59,364 | $10,325 | $49,039 |
| 2023 | $2,668 | $59,364 | $10,325 | $49,039 |
| 2022 | $2,505 | $47,251 | $8,012 | $39,239 |
| 2021 | $2,286 | $47,251 | $8,012 | $39,239 |
| 2020 | $2,850 | $47,251 | $8,012 | $39,239 |
| 2019 | $2,473 | $37,128 | $7,350 | $29,778 |
| 2018 | $2,202 | $37,128 | $7,350 | $29,778 |
| 2017 | $2,081 | $37,128 | $7,350 | $29,778 |
| 2016 | $1,893 | $33,251 | $6,395 | $26,856 |
| 2015 | $1,910 | $33,251 | $6,395 | $26,856 |
| 2014 | $1,913 | $33,251 | $6,395 | $26,856 |
| 2013 | $2,279 | $42,385 | $7,350 | $35,035 |
Source: Public Records
Map
Nearby Homes
- 5440 Asbury Lake Dr
- 3775 Boomer Rd
- 4491 W Fork Rd
- 5476 Audro Dr
- 4201 Boomer Rd
- 3731 Ridgedale Dr
- The McPherson Plan at Ivy Rose - Designer Collection
- Carrington Plan at Ivy Rose - Designer Collection
- Winston Plan at Ivy Rose - Designer Collection
- Calvin Plan at Ivy Rose - Designer Collection
- Miles Plan at Ivy Rose - Designer Collection
- Blair Plan at Ivy Rose - Designer Collection
- Magnolia Plan at Ivy Rose - Designer Collection
- Grandin Plan at Ivy Rose - Designer Collection
- Wyatt Plan at Ivy Rose - Designer Collection
- Avery Plan at Ivy Rose - Designer Collection
- Charles Plan at Ivy Rose - Designer Collection
- 5538 Silverpoint Dr
- 4575 Boomer Rd
- 4628 Boomer Rd
- 5263 Northbend Crossing Unit 92
- 5191 Northbend Crossing
- 5193 N Bend Crossing
- 5263 Northbend Crossing
- 5193 N Bend Crossing Unit 9-3
- 5261 N Bend Crossing
- 5193 Northbend Crossing
- 5261 Northbend Crossing Unit 91
- 5275 N Bend Crossing
- 5187 N Bend Crossing
- 5185 Northbend Crossing Unit 123
- 5201 Northbend Crossing
- 5253 Northbend Crossing Unit 82
- 5251 Northbend Crossing Unit 81
- 5201 N Bend Crossing
- 5203 N Bend Crossing
- 5271 Northbend Crossing Unit 57
- 5334 Meadow Walk Ln Unit 5-I
- 5334 Meadow Walk Ln
- 5334 Meadow Walk Ln Unit 5K