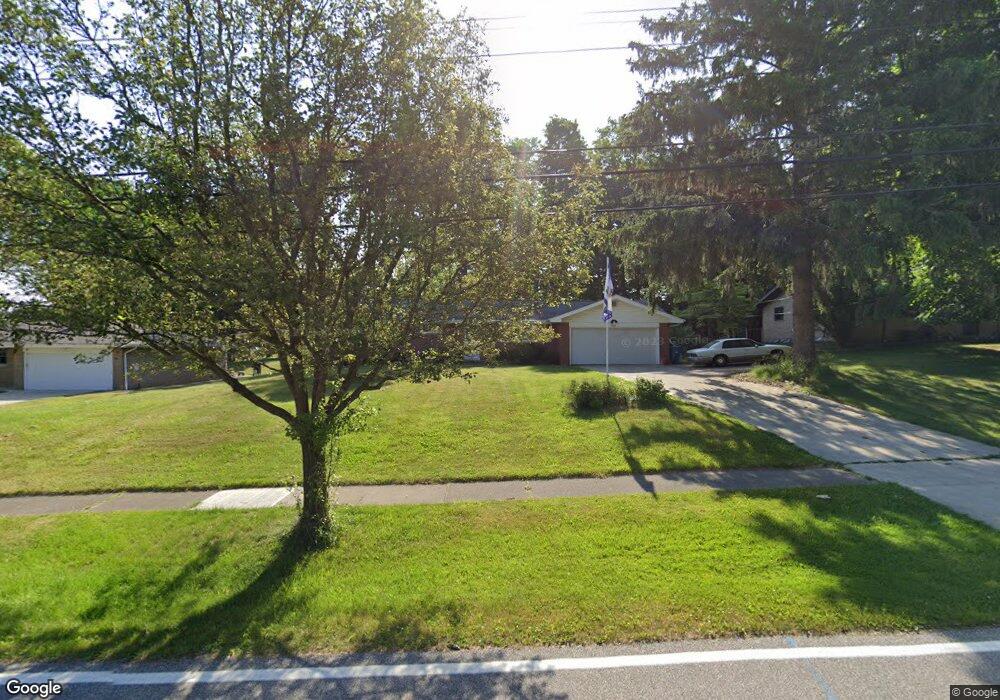
5193 Evergreen 3 4br North Olmsted, OH
Estimated Value: $299,590
4
Beds
3
Baths
1,487
Sq Ft
$201/Sq Ft
Est. Value
About This Home
This home is located at 5193 Evergreen 3 4br, North Olmsted, OH and is currently priced at $299,590, approximately $201 per square foot. 5193 Evergreen 3 4br is a home located in Cuyahoga County with nearby schools including Chestnut Intermediate Elementary School, Pine Intermediate School, and North Olmsted Middle School.
Ownership History
Date
Name
Owned For
Owner Type
Purchase Details
Closed on
Aug 28, 2015
Sold by
Dewerth Jane
Bought by
Browning Edward L
Current Estimated Value
Home Financials for this Owner
Home Financials are based on the most recent Mortgage that was taken out on this home.
Original Mortgage
$99,000
Outstanding Balance
$77,810
Interest Rate
4.09%
Mortgage Type
New Conventional
Purchase Details
Closed on
Mar 16, 1995
Sold by
Reynolds Scott
Bought by
Dewerth Jane
Home Financials for this Owner
Home Financials are based on the most recent Mortgage that was taken out on this home.
Original Mortgage
$124,500
Interest Rate
6.2%
Mortgage Type
New Conventional
Purchase Details
Closed on
Nov 24, 1992
Sold by
Moore Arthur and Moore Edina
Bought by
Reynolds Scott
Purchase Details
Closed on
Jan 1, 1975
Bought by
Moore Arthur and Moore Edina
Create a Home Valuation Report for This Property
The Home Valuation Report is an in-depth analysis detailing your home's value as well as a comparison with similar homes in the area
Home Values in the Area
Average Home Value in this Area
Purchase History
| Date | Buyer | Sale Price | Title Company |
|---|---|---|---|
| Browning Edward L | $132,000 | Cleveland Home Title | |
| Dewerth Jane | $132,900 | -- | |
| Reynolds Scott | $112,000 | -- | |
| Moore Arthur | -- | -- |
Source: Public Records
Mortgage History
| Date | Status | Borrower | Loan Amount |
|---|---|---|---|
| Open | Browning Edward L | $99,000 | |
| Previous Owner | Dewerth Jane | $124,500 |
Source: Public Records
Tax History Compared to Growth
Tax History
| Year | Tax Paid | Tax Assessment Tax Assessment Total Assessment is a certain percentage of the fair market value that is determined by local assessors to be the total taxable value of land and additions on the property. | Land | Improvement |
|---|---|---|---|---|
| 2024 | $5,636 | $82,250 | $22,470 | $59,780 |
| 2023 | $5,049 | $61,820 | $15,230 | $46,590 |
| 2022 | $5,022 | $61,810 | $15,230 | $46,590 |
| 2021 | $4,545 | $61,810 | $15,230 | $46,590 |
| 2020 | $4,172 | $50,260 | $12,390 | $37,870 |
| 2019 | $4,060 | $143,600 | $35,400 | $108,200 |
| 2018 | $3,697 | $50,260 | $12,390 | $37,870 |
| 2017 | $4,112 | $46,200 | $9,870 | $36,330 |
| 2016 | $4,076 | $46,200 | $9,870 | $36,330 |
| 2015 | $3,494 | $46,200 | $9,870 | $36,330 |
| 2014 | $3,494 | $48,130 | $9,590 | $38,540 |
Source: Public Records
Map
Nearby Homes
- 5248 W Park Dr
- 5399 Berkshire Dr
- 5032 Devon Dr
- 27693 Butternut Ridge
- 4958 Hampton Dr
- 4553 Porter Rd
- 5771 Wellesley Ave
- 5943 Porter Rd
- 4345 Martin Dr
- 26902 Butternut Ridge Rd
- 6096 Sherwood Dr
- 29408 Stewart Dr
- 27504 Cottonwood Trail
- 26726 Leenders Ln
- 0 Stearns Rd
- LUCAS TH Plan at Brentwood - Brentwood Townhomes
- LIBBY TH Plan at Brentwood - Brentwood Townhomes
- ABBY TH Plan at Brentwood - Brentwood Townhomes
- 30105 Center Ridge Rd Unit A
- 274 Vista Cir Unit B
- 5193 Evergreen Dr
- 5211 Evergreen Dr
- 5175 Evergreen Dr
- 5194 W Park Dr
- 5229 Evergreen Dr
- 5212 W Park Dr
- 5157 Evergreen Dr
- 5204 Evergreen Dr
- 5188 Evergreen Dr
- 5230 W Park Dr
- 5158 W Park Dr
- 5220 Evergreen Dr
- 5172 Evergreen Dr
- 5247 Evergreen Dr
- 5139 Evergreen Dr
- 5156 Evergreen Dr
- 5140 W Park Dr
- 5265 Evergreen Dr
- 5121 Evergreen Dr
- 5252 Evergreen Dr